Hi everyone,
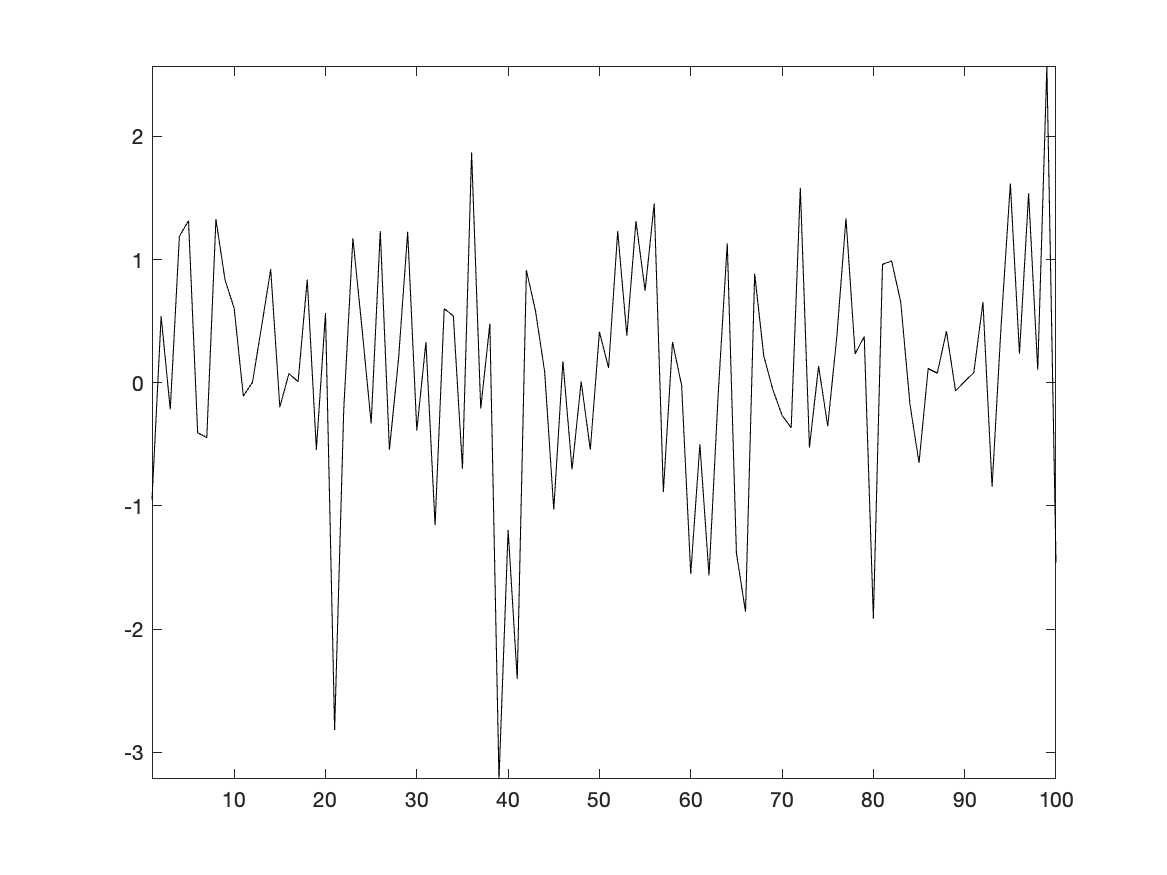
I’m working with dseries class, but when I try to plot an object (with the overloaded plot function), dates won’t be displayed in the x-axis but rather the default XTicks:
% dseries - MWE 1
clear, clc, close all;
rng(1234)

qq = dates('Q'); % Instantiate qq object
xData = randn(100,1);
ts = dseries(xData,qq(2000,1),{'myVar'});

figure;
plot(ts,'k');
print('mwe_1','-dpng')
Furthermore, when trying to plot two series, rather than sharing the same x-axis and having two lines, they get mapped into each other like a scatter plot:
% dseries - MWE 2
clear, clc, close all;
rng(1234)

qq = dates('Q'); % Instantiate qq object
xData1 = randn(100,1);
xData2 = randn(100,1);
ts = dseries([xData1 xData2],qq(2000,1),{'myVar1','myVar2'});

figure;
plot(ts.myVar1,ts.myVar2);
print('mwe_2','-dpng')

I have two questions:
- In the first example, Shouldn’t the
plotfunction handle the labeling? I saw this post when it’s said that dates being displayed should be the expected behavior. Taking a look at the function’s code (located atmatlab/dseries/src/@dseries/plot.m), I don’t really understand the section which handles this matter:
function h = plot(o, varargin)

% Overloads Matlab/Octave's plot function for dseries objects.

% Copyright © 2013-2017 Dynare Team

...

switch ndseries
  case 1
    if isequal(nvariables,1)
        hh = plot(o.data,varargin{:});
    else
        ...
        hh = plot(o.data);
    end
    axis tight;
    id = get(gca,'XTick');
    if isequal(id(1),0)
        dates = strings([o.dates(1)-1,o.dates(id(2:end))]);
        skip_relabeling=0;
    else
        ID = id(find(isint(id)));
        if any(ID<o.dates(1).double) || any(ID>o.dates(end).double)
            skip_relabeling=1; %hold on was used so that axis tight did not restrict current xlim to dseries used.
        else
            set(gca,'XTick',ID);
            dates = strings(o.dates(ID));
            skip_relabeling=0;
        end
    end
    if ~skip_relabeling
        set(gca,'XTickLabel',dates);
    end
  case 2
    ...
  otherwise
    error('dseries::plot: This is a bug! Please report the bug to the authors of Dynare.')
end
Just after axis tight the code gets the XTick and tries to check if the first element is zero (which doesn’t happen in the MWE 1, it starts at 10), since this isn’t the case, it jumps at the else block where an additional ID variable is created (I thinks it’s used when plotting monthly data), then the statement any(ID<o.dates(1).double) || any(ID>o.dates(end).double) is tested, where I don’t quite get when that would be false, and I think this is the reason dates aren’t displayed, because skip_relabeling is set to 0, skipping entirely the labeling.
- In the second example, looking at the code it seems that the default behaviour would be to plot two series (
ts.myVar1andts.myVar2) with a common x-axis (handled by thealignmethod), but the only way I’m getting that result is by either passing only onedseriesobject (e.g.plot(ts)), or concatenating them (e.g.plot([ts.myVar1 ts.myVar2])) or plotting separetely usinghold on, which I think it defeates the purpose of overloadingplotto have a more convenient way to graphically display time series without the burden of setting the format by hand. Is this the expected result or is some kind of bug?
Thanks in advance for your help!
S.
PD: I’m running Dynare 6.2 with MATLAB R2024a.