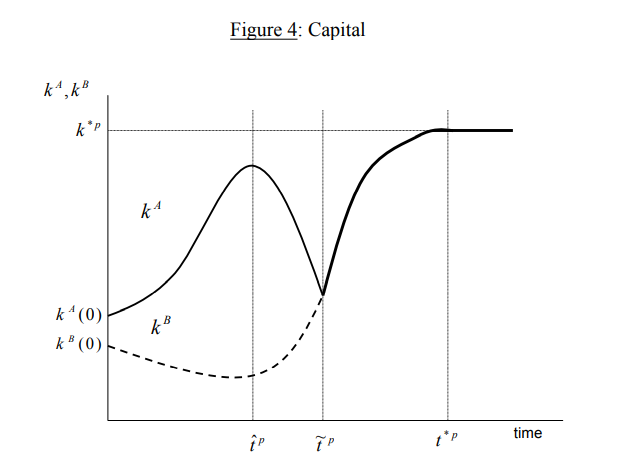
Respected all, thanks in advance for your help. I am struggling to get the transition to steady state values’ graph starting from a given initial values. While trying to replicate the Sequential City Growth Model (Cuberes, 2009), I was able to solve the model and write its Dynare code (attached) and also got the theoretically consistent results. As shown in Fig 4 of the attached paper, the goal of the exercise is to get the time path required from initial values to reaching its steady state values, which I don’t know how to do it. Specifically, I need to find the t^p when capital per worker in city A will reach its maximum value and starts to decline. Thanks once again.
Code.mod (1.3 KB)
cuberes (2009).pdf (534.7 KB)
Notes and Model Solution.pdf (440.1 KB)
