Well, one of the reasons I chose this model was that the foreign economy is modelled explicit.
Anyway, I’m probably going to drop the irf analysis and focus on estimation of parameters, VD and optimal policy. What I want to do is to find the optimal monetary policy weights in this estimated model with different weights on the taylor rule: inflation, output, output growth and past inflation(t-1).
So my questions are if it’s possible to use the estimation values directly in the optimal policy? Should I enter the taylor rule parameters in the osr_params as well? And can osr follow directly after the estimation and stoch_simul command?
Thanks!
What exactly are you trying to do? estimation under optimal policy? Or estimating the model and then checking what would happen under optimal policy?
I want to estimate the model, VD from stoch_simul (which timeperiod is displayed in the matlab window? Or is it an average?) and then an optimal policy analysis of the monetary policy, like minimize the variances of inflation, output and interest rate?
When I use moments_varendo in the estimation, I get the following error:
“Error using compute_decision_rules
Too many output arguments.”
Thoughts?
This looks like a bug. Can you please provide the full error message?
Thank you. I was trying to run conditional VD in the estimation command, but I switch to the stoch_simul (as discussed above earlier) and I’m fine with that.
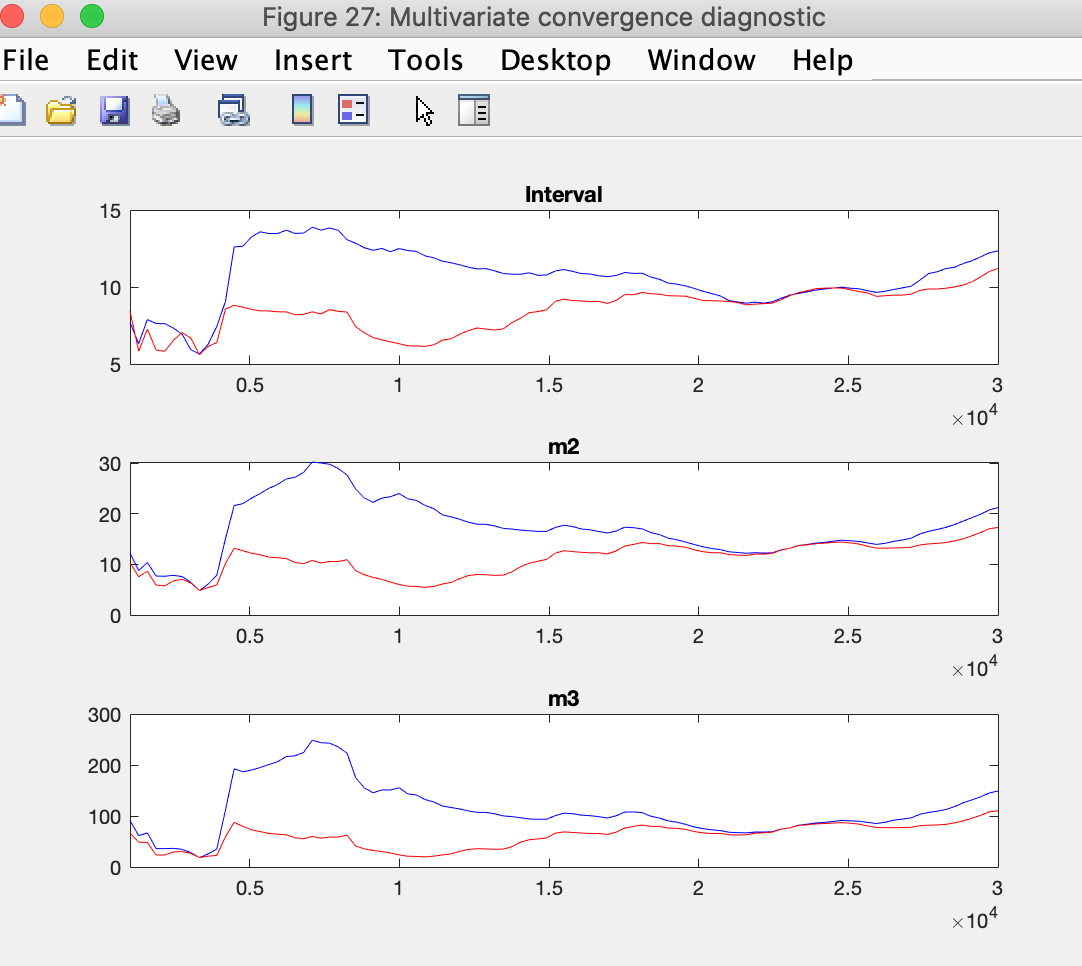
Anyway, I still doesn’t manage to get perfect Brooks and Gelman (1998) plots, this is the best I’ve got
What could be the reason for this? Could the standard errors of the priors be related? I’m using 0.05-0.1 for most priors. I’ve tried to change some with different results.
I find these diagnostics very hard to interpret. How do the trace_plots look like?
Is there a way to plot all the parameters in one command and not one at a time?
Use the generate_trace_plots-command.
I get these errors
"Not enough input arguments.
Error in generate_trace_plots (line 37)
if chain_number>record.Nblck
Error in model.driver (line 833)
generate_trace_plots;
Error in dynare (line 281)
evalin(‘base’,[fname ‘.driver’]);"
You need to provide the chain number in brackets, e.g. generate_trace_plots(1) for the first chain.
Here are my trace plots for the 2nd chain (couldn’t fit all in one pdf due to the size…). Some really look bad.
trace1.pdf (2.3 MB)
trace2.pdf (2.2 MB)
trace3.pdf (1.6 MB)
trace4.pdf (1.9 MB)
My log data density is also 855
" ESTIMATION RESULTS
Log data density is 855.630713."
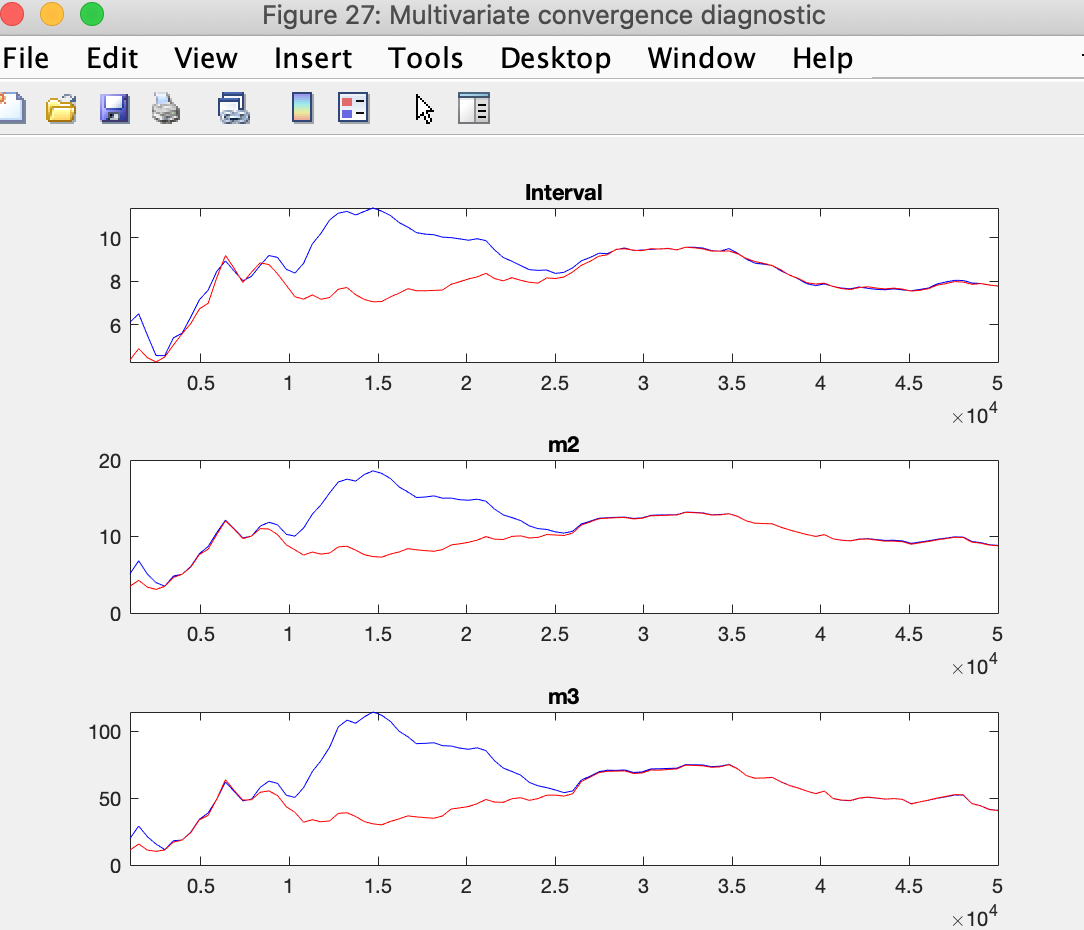
but the Brooks and Gelman (1998) plots looks better now (I did change the specification on some priors).
There is clearly a drift. At a minimum, you need a lot more draws.
How many? 100 000? Or more? I’ll try 100 000 now see what I get. Can’t believe I wasted 2 weeks or more and didn’t try more draws… thank you!
Edit: Also, should I reduce the burn-in when I increase the number of draws? Or will it be fine to always use a 50% burn in for example?
Set the burn-in to 10% and do 1 million draws.
Hmm, I tried 200 000 yesterday and it took 2,5 hours. I’ll try 1 million over night or something.
Here is a sample from 1m draws
trace1m.pdf (1.3 MB)