Hi all,
I have just installed Dynare 7 and tried to replicate some DSGE estimation results I had been running on Dynare 6.4.
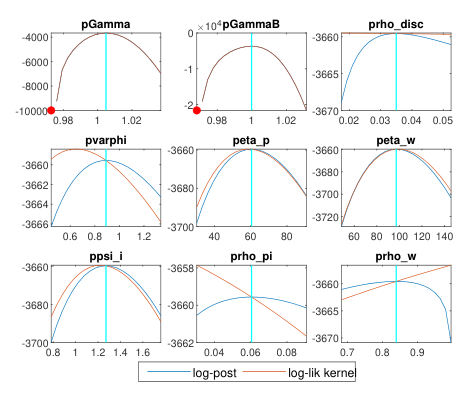
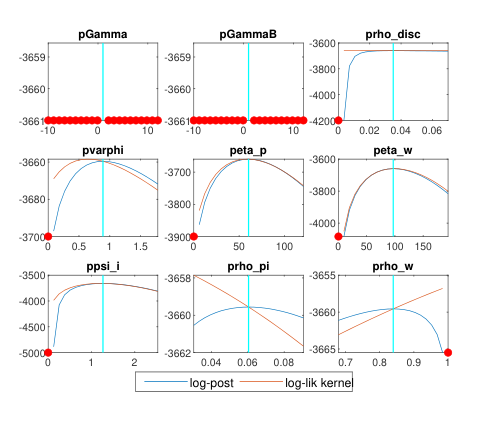
I am using mode_compute=5. One thing I noticed was that the mode_check_plots were extremely different even though the numerical results were essentially unchanged (third decimal differences), both for “Final value of minus the log posterior” and the mode/s.d. in “RESULTS FROM POSTERIOR ESTIMATION”. It seems that the previous versions of Dynare were able to “zoom in” on nondegenerate regions of determinacy, but version 7 just defaults to a x-axis bounds of [-10, 10]. See the images below, for v6.4 and v7.0.If you squint hard enough, you can see that the cyan lines are identical in the two figures.
As I said, the numbers are the same, so this does not seem to materially change the results, but I always find these plots useful diagnostic tools and this type of behavior kind of defeats their purpose. Does anyone know if this is something that can be configured/changed? Thanks
Can you provide me with the file to replicate the issue?
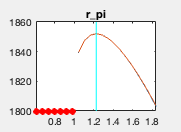
Dear Professor Pfeifer,I am estimating a DSGE model . I am encountering an issue with the estimation of the Taylor rule parameter (inflation coefficient).As shown in the attached mode_check plot:The posterior mode is approximately 1.22, which is very close to the indeterminacy region (where BK conditions are not satisfied).The left side of the posterior density appears to be truncated by the red-dot zone, suggesting that the data likelihood favors a smaller parameter that the structural model cannot accommodate.
In this case, should I be concerned about the reliability of the MCMC sampling (Metropolis-Hastings), as the sampler might frequently hit the non-stationary boundary?
Furthermore, given that the Japanese economy has been in a liquidity trap for a long time, does this “boundary-hitting” behavior suggest a fundamental conflict between the standard Taylor Principle and the data, or is it likely a sign of weak identification?
That plot does not look too bad. 1.2 is pretty far away from the boundary of 1.