Hi everyone,
I have a model that can be estimated using mode_compute=6, but I get very problematic mode check plots and I do not know how to tackle this problem. I have multiple problems in my plots:
- I have many red dots, this does not surprise me or worry me too much, because the solution of the steady state does not allow a big range for many parameters.
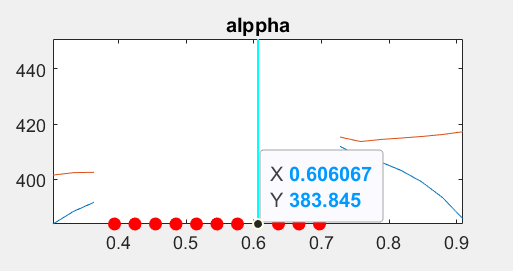
- I have plots (e.g. alppha), where the log-posterior and the log-lik kernel are not smooth continuous and importantly do not cross the vertical line indicating the estimated mode.
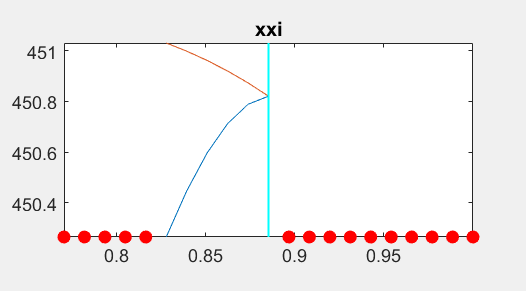
- I have plots (e.g. xxi), where the lines approach the vertical line from one side and may be tangent to the vertical line, but then stop. This, if I understand correctly can come from a corner solution.
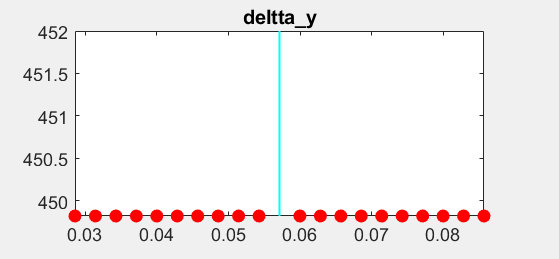
- I also have plots, where there are no lines at all, but a vertical line is still visible.
I don’t know what I need to do to fix these problems. Does anyone have an idea as to how to improve the plots? I attached the mod, steady state file and data file also to this post (The model in Dynare was log-linearized).
EnvironmentA.mod (7.4 KB)
EnvironmentA_steadystate.m (8.3 KB)
MyData.xlsx (10.6 KB)