Dear Sir,
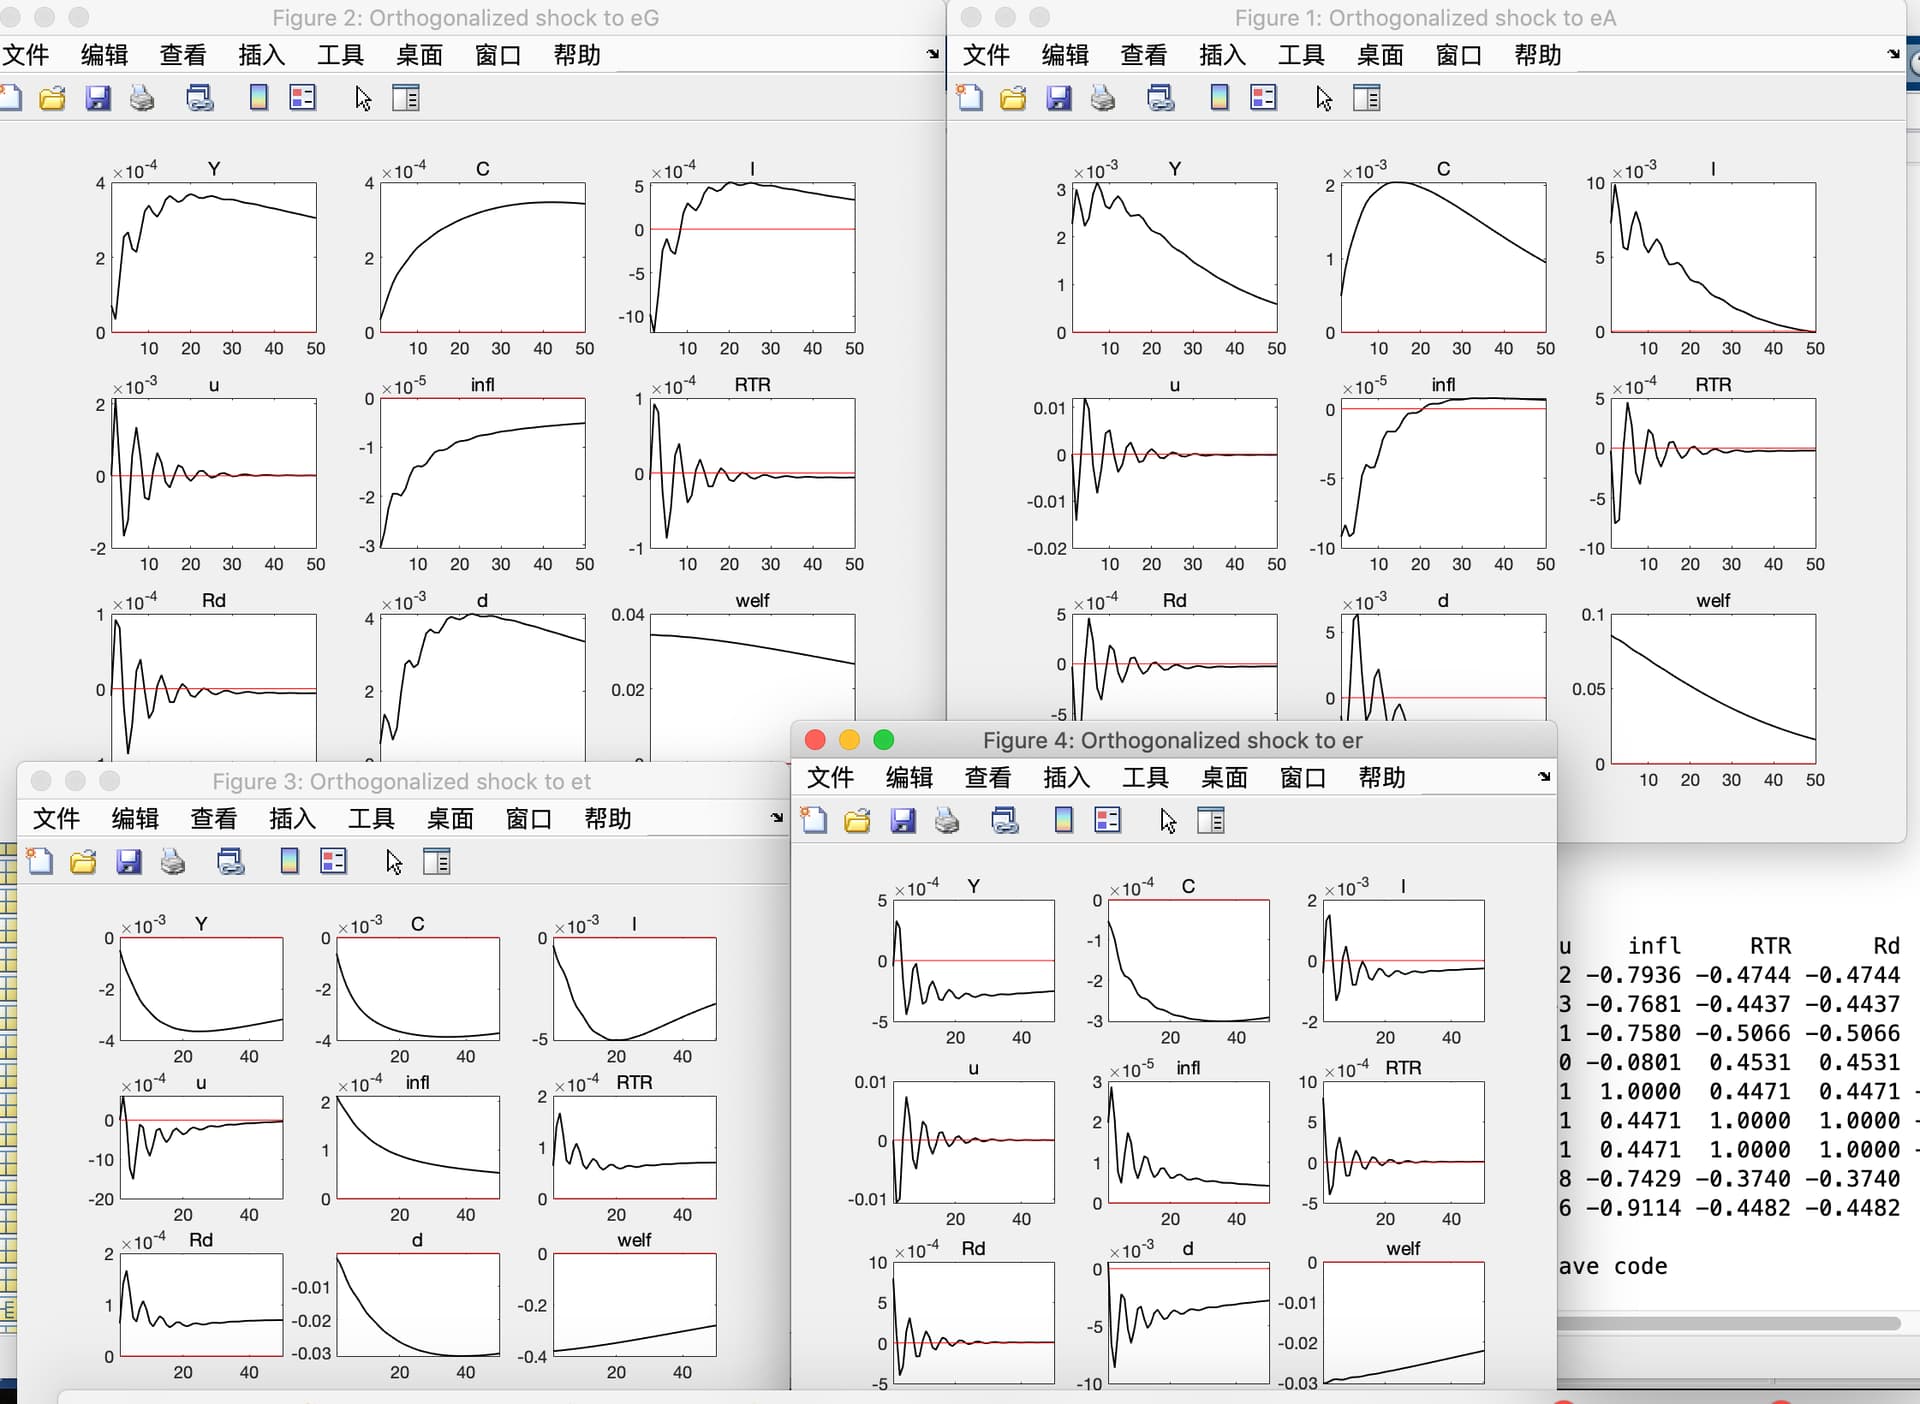
When I ran the model, I got some strange figures. The curve of some variables presented the characteristics of oscillation convergence as the picture shows.
1.What is the reason of the phenomenon?
2.How Can I understand the result?
3.How Can I make the curve smooth?
Y means Output
I means Investment
infl means inflation
C means consumption