Hi there
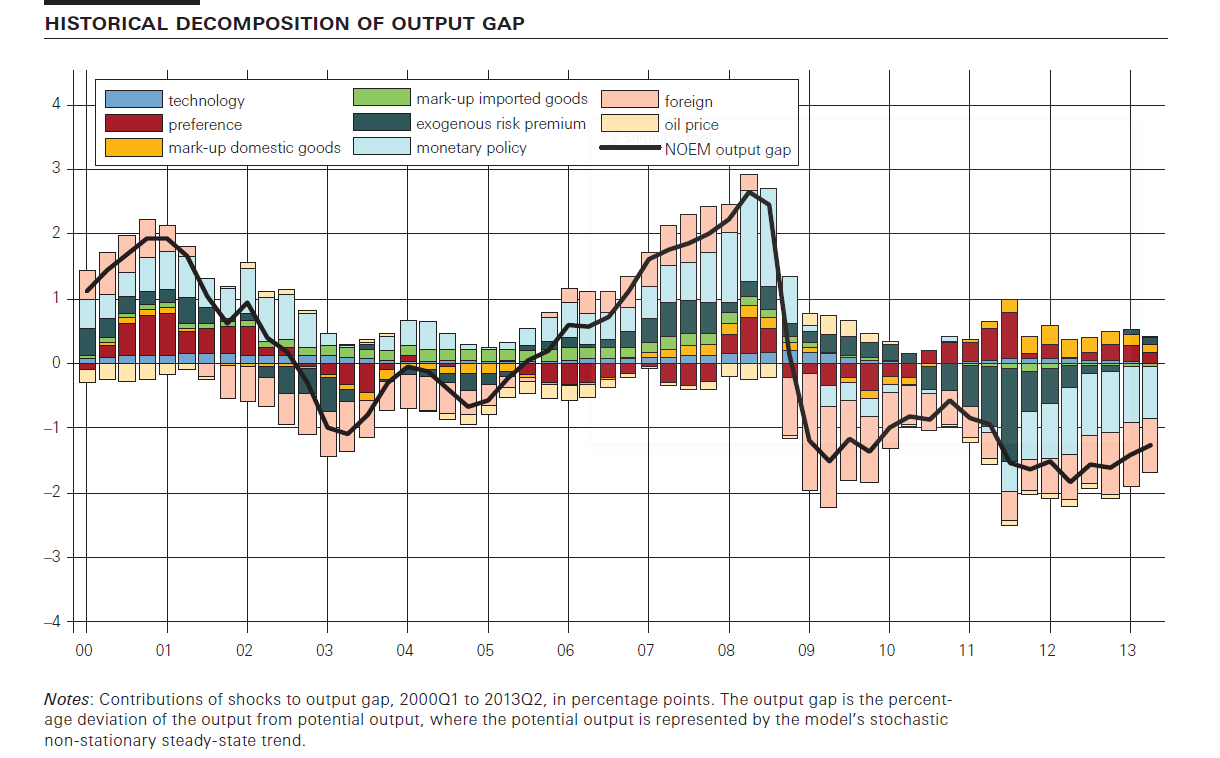
Does somebody know whether Dynare has a function in order to make a graph of the historical variance decompositions as attached here?
Would appreciate a tipp/some feedback 
Best
This is not a variance decomposition, it’s a historical shock decomposition. See e.g. tests/shock_decomposition · master · Dynare / dynare · GitLab
Thanks