Hi, i’m trying to pick up the dates that the regime change in a markov switch model, but i can’t do this only seeing the graph that appear with the command ‘ms_compute_probabilities’.
Like this graph below, the data is very sparce on the x axis(horizontal line), so i can’t determine exactly when the 2 regimes occurs.
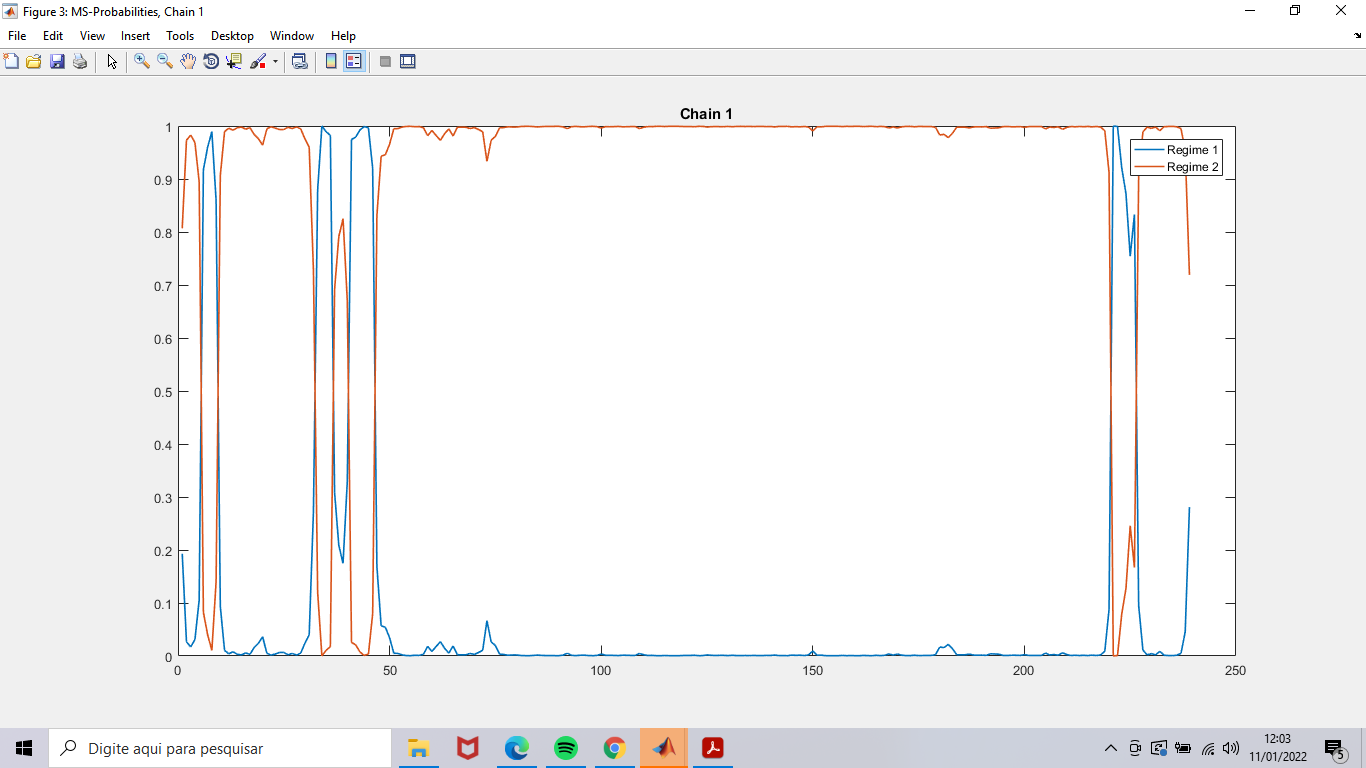
Is there a way to change the x axis to be more detailed or an output that show the probability for each time? I went to the output/probabilities paste but just have the graph above.
Thanks everyone!