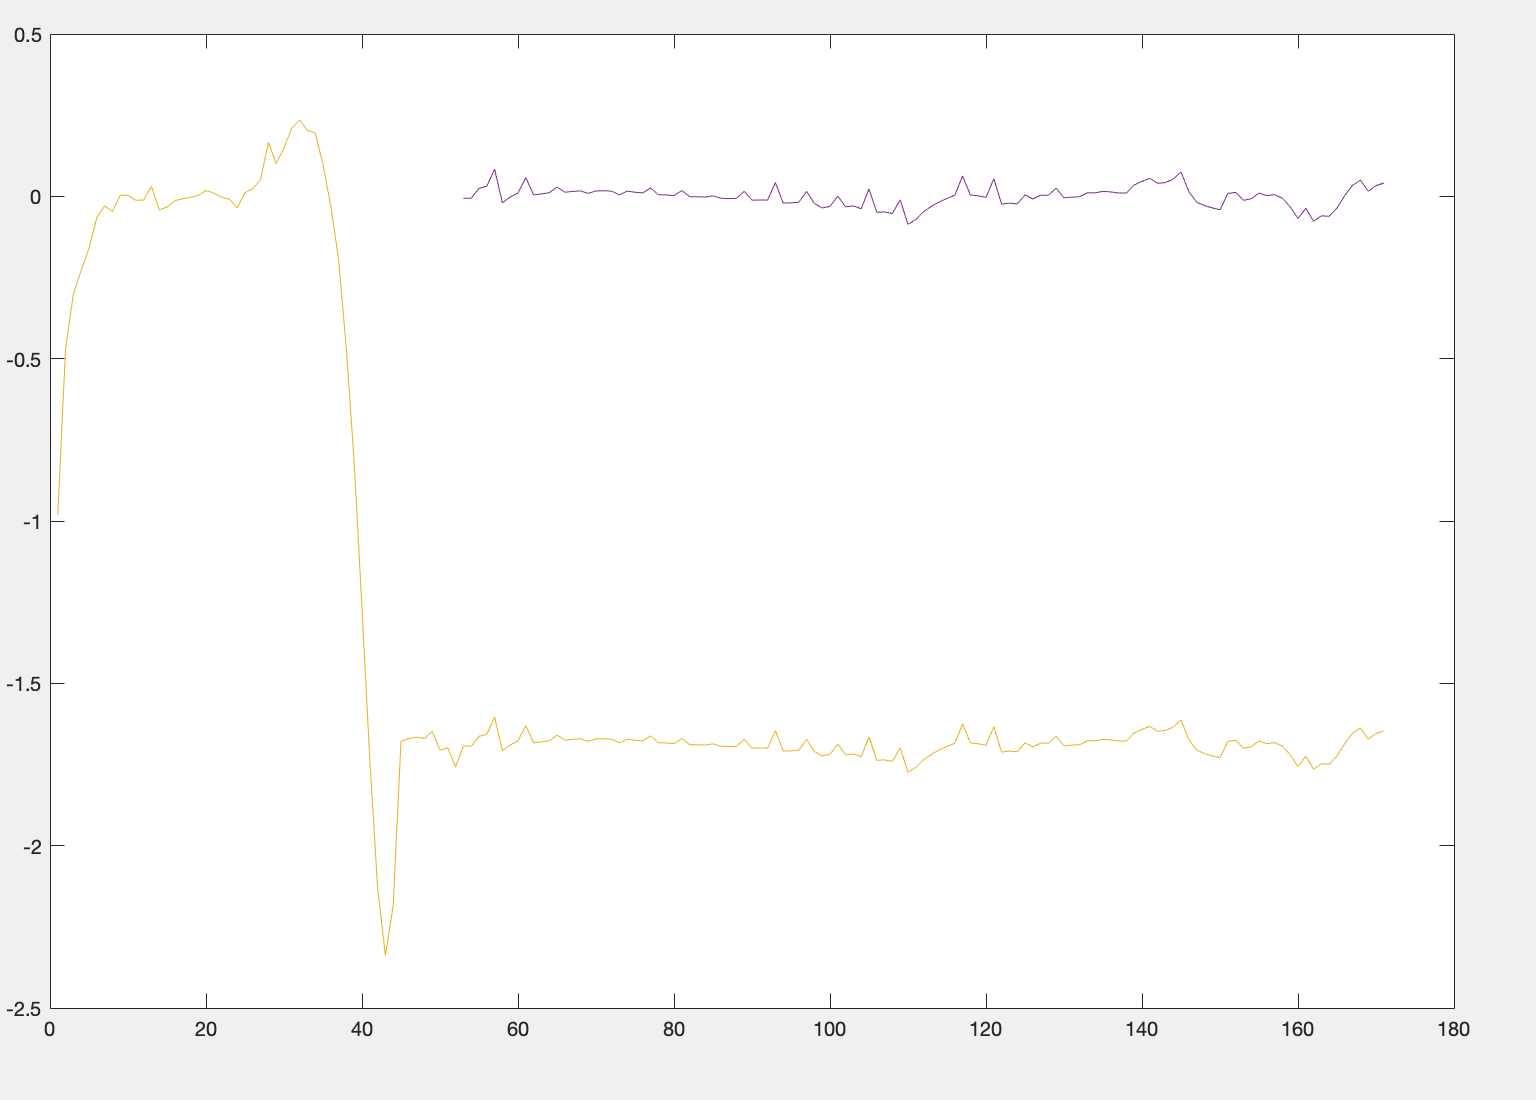
Hi Professor, I got one question about the last column of oo_.shock_decomposion? It is the smoothed variables, right? I thought it should be equal to the observed data if the data was used to estimate, however, when I plot the last column of a smoothed variable, say RER, and compared with the observed RER, they are different. But the gap between two plot are constant: -1.68. However, the RER in oo_.SmoothedVariables equals the observed data. Please see the figure below. The purple line is observed one with zero mean, but the yellow line which is the smoothed one from historical decomposition has non-zero mean.
Why this happen? In addition, the mean other smoothed variables are all non zero. Is that normal? I am pretty sure that the observed data for estimation have zero mean, although the oo_.SmoothedVariables have zero mean. I am uploading the mod file for your reference. Thank you so much.
estimation 2 2.zip (256.4 KB)
I think there are typos in your post. You write:
while column M_.exo_
In any case, from the manual on oo_.shock_decomposition:
nbr+2 stores the smoothed value of the respective endogenous variable in deviations from their steady state, i.e. the mean and trends are subtracted.
Thank you so much for your reply.
I am still a little bit confused. Given that the column nbr+2 stores the smoothed variables in deviation from steady state, it should be equal to smoothed variables stored in oo_.SmoothedVariables since the smoothed variables are also stored as the deviation from steady state , am I right? For example, if RER is the observed data used for estimation, then the respective RER in oo_.SmoothedVariables should be equal to the observed RER, and in addition, it’s also equal to the respective one stored in nbr+2 of oo_.shock_decompostion. Am I understanding correctly? If it is correct, in my model, they are different and the difference is a constant. In addition, the nbr+2 in oo_.shock_decomposition are not fluctuate around zero line, instead, many of them are far away from zero line. Is that normal?
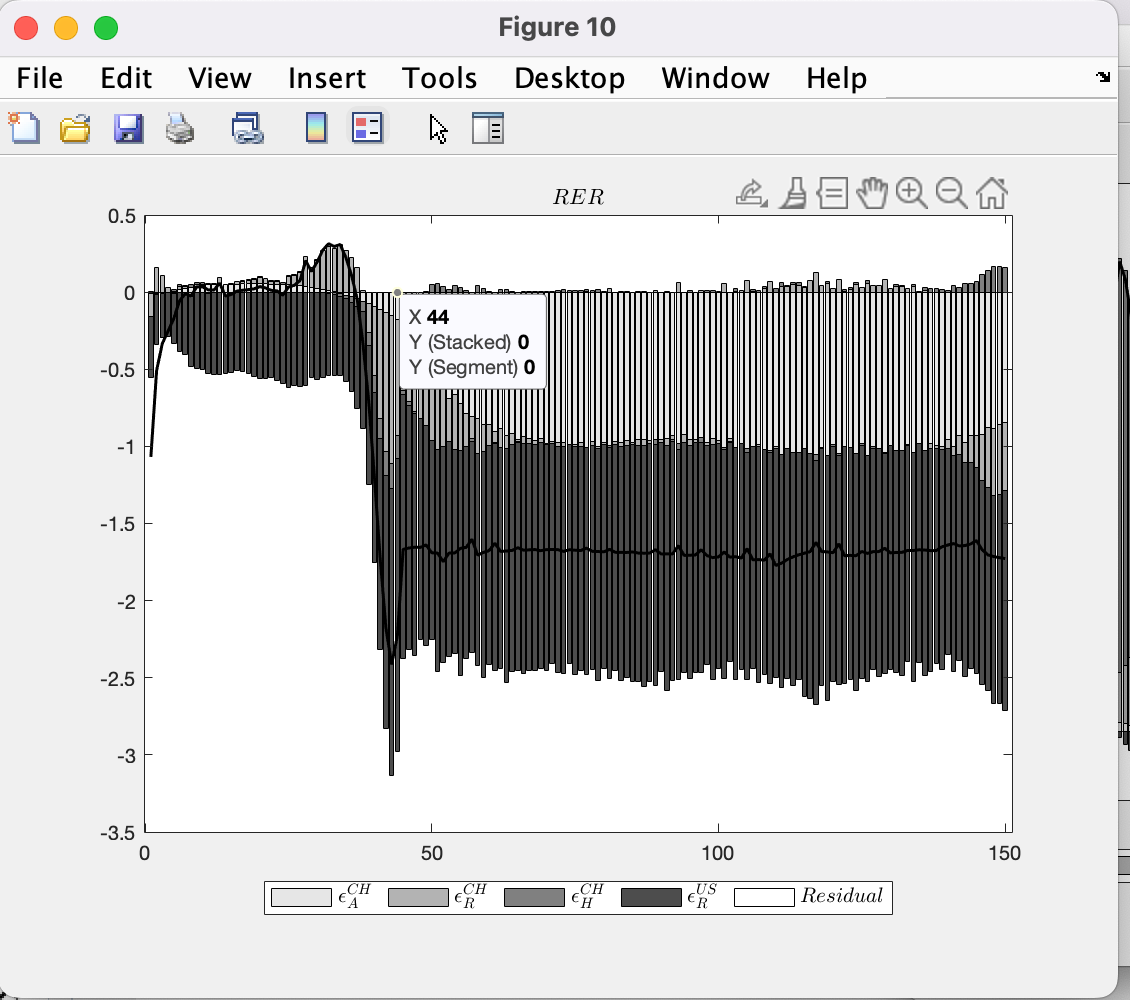
This is the historical decomposition of RER and the black line draws nbr+2. RER is also the observed data.
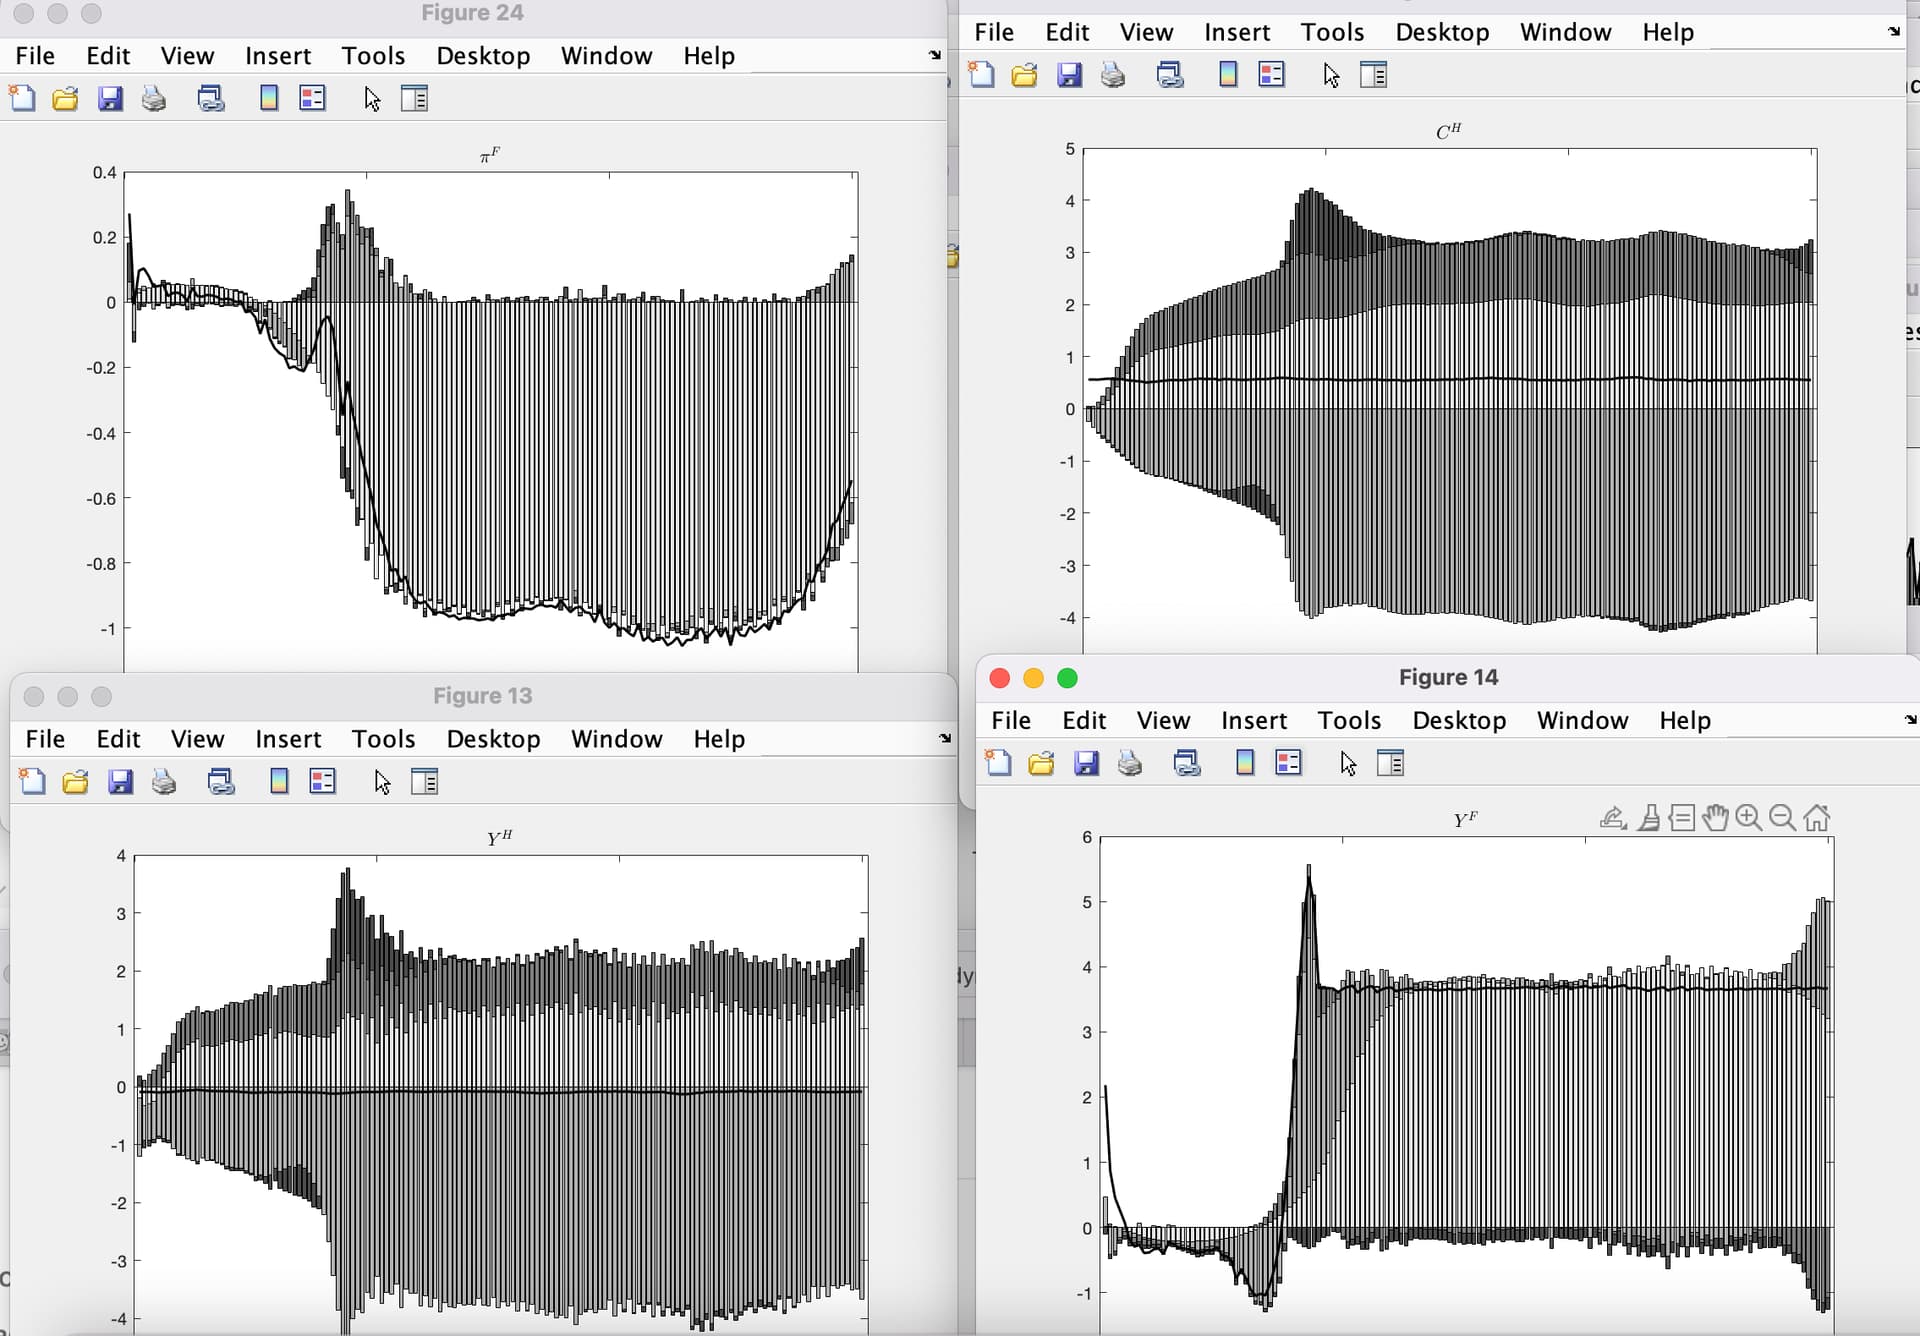
Some other historical decomposition seems strange too.
Are they normal? If they are normal, how to interpret the pattern of sudden and persistent increase or decrease?
Thank you so much for your help. Looking forward to your reply. Thank you!