Dear all,
When I use output and consumption data, I can produce results. But when using output, consumption and investment data, it shows ‘The forecast error variance in the multivariate Kalman filter became singular’. Why is there such a mistake? Hope someone helps me find out the mistake, thank you in advance.
data.xls (33 KB)
lowrisk.mod (5.6 KB)
Error using initial_estimation_checks (line 143)
initial_estimation_checks:: The forecast error variance in the multivariate Kalman filter became singular.
Error in initial_estimation_checks (line 143)
error(‘initial_estimation_checks:: The forecast error variance in the multivariate Kalman filter became singular.’)
Error in dynare_estimation_1 (line 165)
oo_ = initial_estimation_checks(objective_function,xparam1,dataset_,dataset_info,M_,estim_params_,options_,bayestopt_,bounds,oo_);
Error in dynare_estimation (line 105)
dynare_estimation_1(var_list,dname);
Error in lowrisk (line 362)
oo_recursive_=dynare_estimation(var_list_);
Error in dynare (line 235)
evalin(‘base’,fname) ;
Just checked your code…looks like you have 3 shocks for 3 series…so that is ok…
it could be that the model predicts through the goods market clearing that output should perfectly equal c + i …whereas in the data this cannnot be the case…
Why don’t you try to replace the mon pol shock with a govt spending shock in the goods market clearing condition…?
Reuben
Reuben, thank you for your advice. I think I know where the problem is.
I have another question. When I increase interest rate smoothing on the Taylor rule, why does result change a lot? Is it normal?
Blockquote
//13. Taylor Rule
r = kappa_r * r(-1) + ( kappa_y * yl + kappa_pi * pi) + mu_r;
// r = kappa_r * r(-1) + (1-kappa_r)*( kappa_y * yl + kappa_pi * pi) + mu_r;
Yes, results will be very different. In the first equation, kappa_y and kappa_pi represent the short-run elasticities of the interest rate to output and inflation. In the second, they represent the long-run average response. To understand that, evaluate the policy rule in steady-state.
If you back out the long-run coefficients from the first equation, i would be surprised if the results are very different from those obtained for the second equation.
Cheers
Reuben
Reuben,thank you for your quick reply. The first three pictures are ‘r = kappa_r * r(-1) + ( kappa_y * yl + kappa_pi * pi) + mu_r;’ The last three pictures are ‘r = kappa_r * r(-1) + (1-kappa_r)*( kappa_y * yl + kappa_pi * pi) + mu_r;’
And VARIANCE DECOMPOSITION SIMULATING ONE SHOCK is following
‘r = kappa_r * r(-1) + ( kappa_y * yl + kappa_pi * pi) + mu_r;’
eps_al eps_r eps_pi Tot. lin. contr.
yl 57.18 39.45 2.46 99.09
cl 92.52 4.15 2.15 98.82
‘r = kappa_r * r(-1) + (1-kappa_r)*( kappa_y * yl + kappa_pi * pi) + mu_r;’
eps_al eps_r eps_pi Tot. lin. contr.
yl 81.39 15.46 3.93 100.78
cl 96.72 1.47 1.56 99.75
I’m not sure if I did the right thing .The results between two Taylor rule Is significantly different?
Or I did the right thing?
data.xls (33 KB)
lowrisk.mod (5.7 KB)
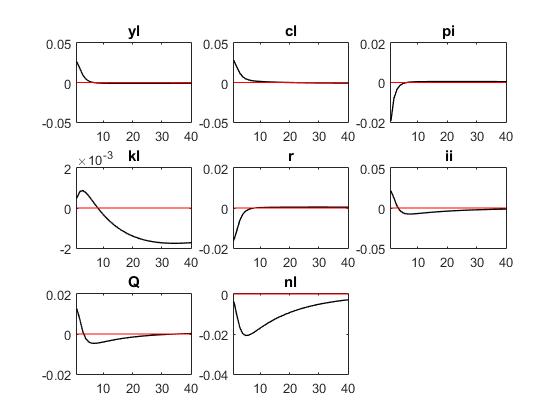
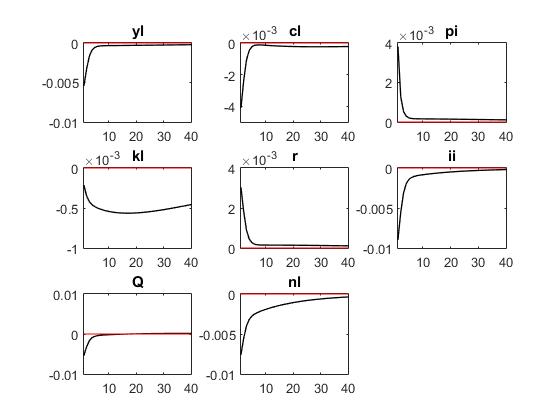
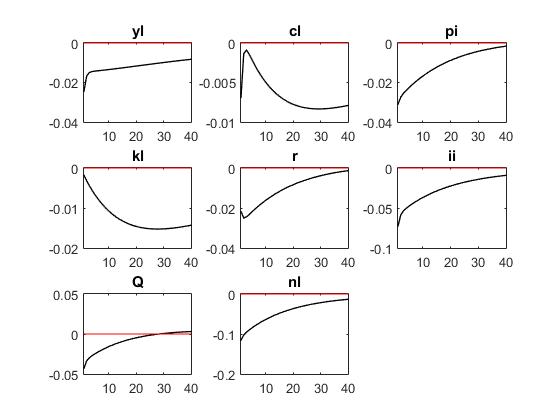
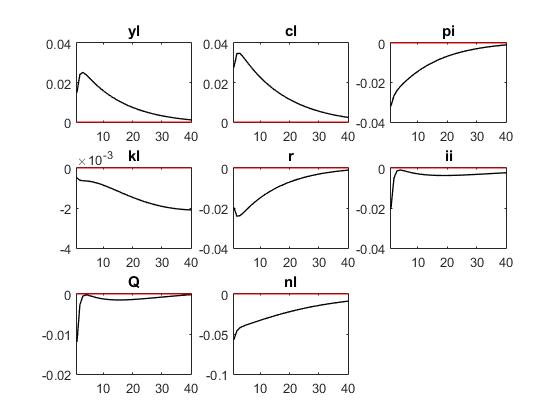
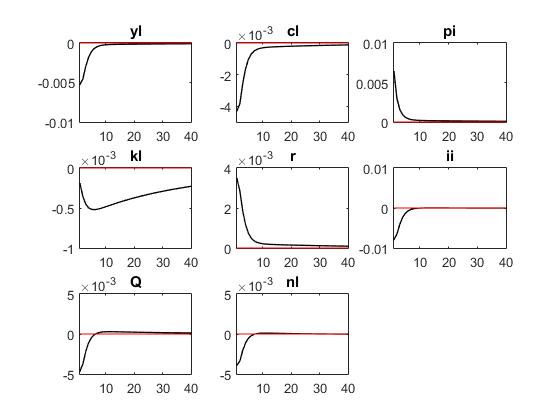
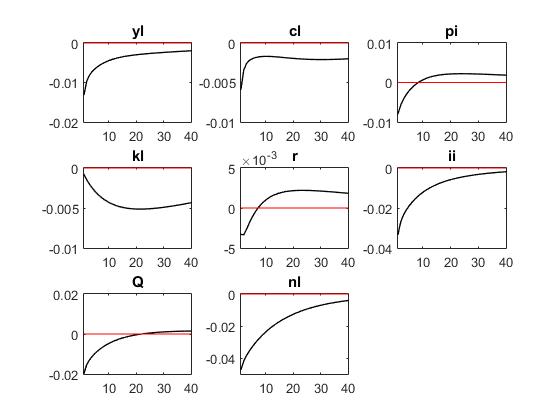
From what I can see, for both specs of the taylor rule, you are using the same parameter values
kappa_r = 0.5 ;
kappa_y = 0.5 ;
kappa_pi = 1.5 ;
This does not make sense because in the first one, you are fixing the short-run responses and in the second one you fix the long-run responses. Why should results be the same?
Reuben,I see most articles about the financial accelerator model. They use taylor rule one .
While taylor rule two seems to use more popularly. I’m sorry I don’t know the difference between them.
I have another question to ask. In Bayesian estimation, the use of different data will produce different results, very different results. Variance decomposition is very different and impulse response diagram is also different. Is this normal?
Yes the results will be different. Have a look at the two literatures and see how the Taylor rule parameters are calibrated. If there is no smoothing involved, the short-run and long-run responses are the same.
Cheers
Reuben
Where was your original issue @zwinner?
I have a similar issue: same number of shocks as observables, the data is full rank, but I still get the error.
Thanks for the tip! I tried using only standard NK variables (y, pi and R) and I still get the same problem
Then maybe the issue is the Taylor rule, which can imply an exact linear combination of these three variables.


