Hello everyone,
I am estimating a model with Financial frictions. The problem is that i get some strange results. For example the Historical Variance decomposition.
What I do is to take logs, detrend the variables (with the Matlab command detrend) and use the differences in the measurement equation.
My original data for y (not in differences) and the data generated by the model for this variable y (the observable is dy) has the same shape but differently scaled. Is there a problem with this? Can my estimations be wrong? Am I doing something wrong with the data?
Moreover, the estimated Calvo parameters for wage and price are really low in comparison with other similar models, 0.34 and 0.25. The risk aversion coefficient of the CRRA utility function is close to 0 (0.05).
Thank you very much in advance!
PD: I attach my data file mod file and graphsFF_DSGE.mod (7.6 KB)
GD_data.mat (5.4 KB)
- I am unable to follow. The
shock_decomposition command decomposes the observable data, which is dy in your case, not y. So how do get to y? Did you simply cumulate dy?
- Your data is not mean 0, while the model variables are. This is a problem.
dy has a mean of 0.0325, implying growth that the model cannot capture.
- In Dynare 4.5.5 it get the error
Error using initial_estimation_checks (line 143)
initial_estimation_checks:: The forecast error variance in the multivariate Kalman filter became singular.
First of all thank you for the help.
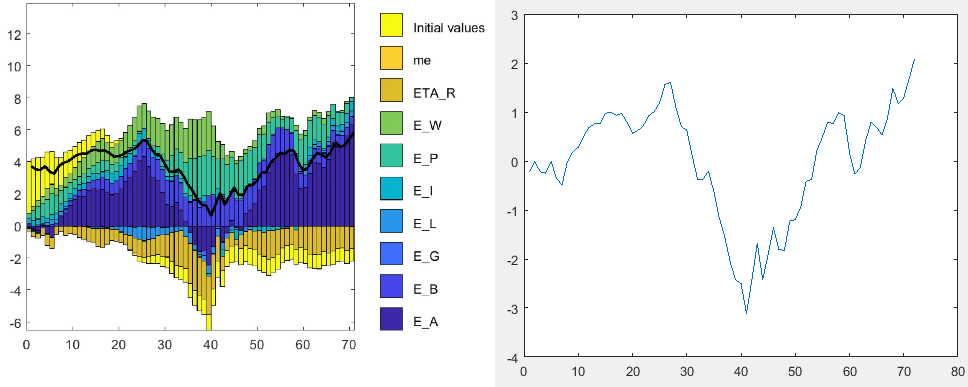
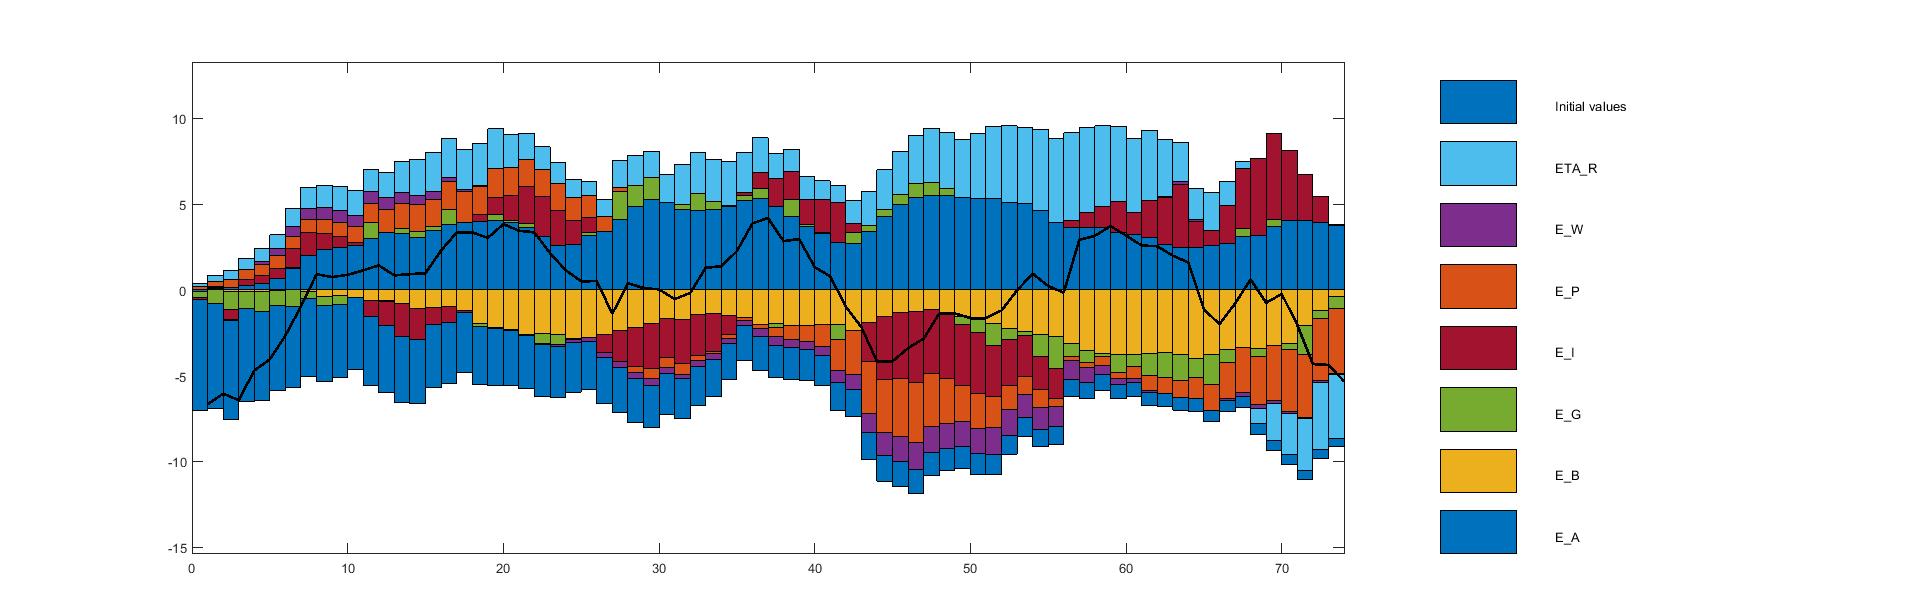
I have solved the problem about the 0 mean. Now, I am using as observable the variable itself not the differences and estimating the model from 1964:2 to 1982:3. The problem now is that in the Historical variance decomposition I get that the productivity shock (E_A) is always positive and the risk premium shock (E_B) is always negative, what seems strange and I am not able to figure out why. Is it possible that the shocks are not well indentified?
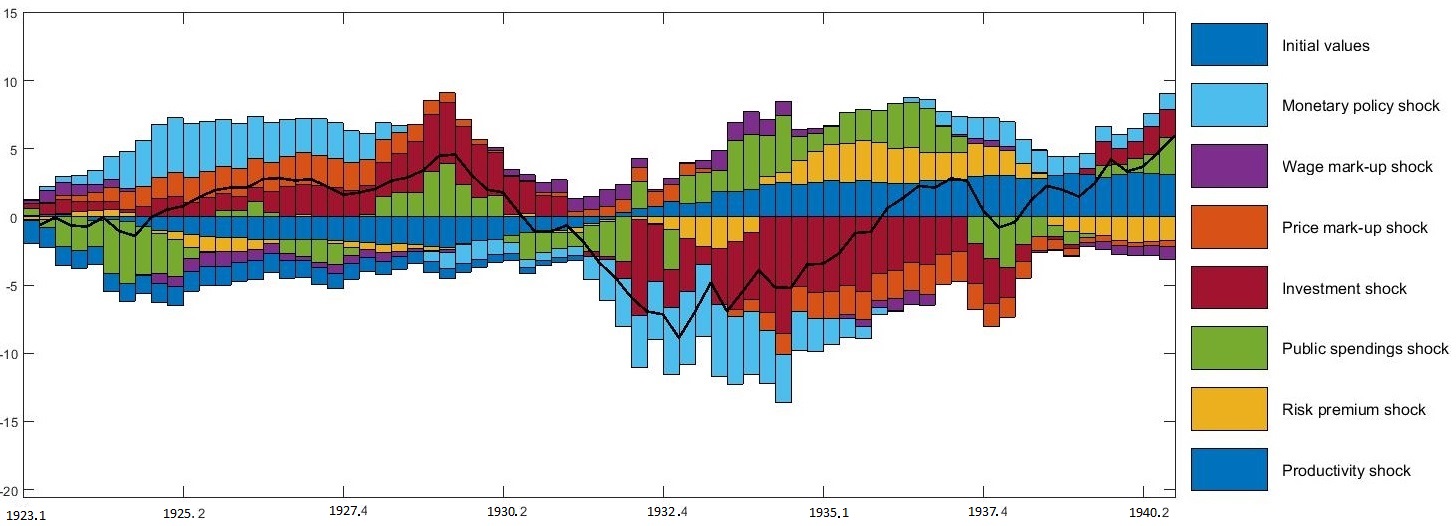
I also carry out the estimation of with the same model but for the period 1920 - 1940 and the results seem to be more reasonable.
Any help would be really appreciated
Thank you in advance
FF_DSGE.mod (7.8 KB)
Stagflation_data.mat (4.6 KB)
Given that this is not the case for all variables and all samples, an error is relatively unlikely. Maybe there is actually something in the data that causes this pattern. You need to look at all observed variables in conjunction.