Simulated kurtosis reported incorrectly?

All,

The numbers below were generated using the attached (but occur in more complicated setups as well).
MWE.mod (439 Bytes)

The simulated moments from a run of 10,000,000 periods (stoch_simul(order = 2, periods=10000000)) are:

The reported kurtosis for Y_SHOCK looks wrong. Y_SHOCK is normal, so should have a kurtosis of around 3?

And it does, specifically running the matlab command below gives what you’d expect:
image

which is far off the 0.001278 reported by dynare?

I may be missing something, of course, but otherwise it looks like dynare isn’t actually reporting the sample kurtosis?

Thanks for reading and potentially looking into this,
Pawel

Hi, if you open the disp_moment routine and search for kurtosis you will see that we subtract off 3. In Dynare we report the excess kurtosis (see wikipedia):

\mathbb{E}\left[\left(\frac{X - \mu}{\sigma}\right)^4\right]-3

and not the kurtosis. It is true that the reference manual is inaccurate and does not give this information, this will be fixed in the next release. Thanks for reporting.

Best,
Stéphane.

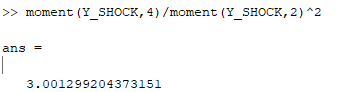
Ex-post the difference of 3 is pretty glaring, but then many that’s true of so many other things… :slight_smile:

And I guess the potentially less labor intensive solution would be not to subtract the 3, in which case both the manual and the label in the table would be 100% accurate (though I can see the merits of the subtraction, of course).

Anyway, thanks for clarifying Stéphane - much appreciated!