Dear all,
I tried to use the below command to do recursive forecast when I replicated RMSE of SW2007.
estimation(optim=('MaxIter',200),datafile='usmodel_data.mat',mode_compute=0,mode_file=usmodel_hist_dsge_f19_7_71_100_mode,nobs=[71:170],presample=4,lik_init=2,prefilter=0,mh_replic=2500,mh_nblocks=2,mh_jscale=0.20,mh_drop=0.2,forecast=14,nograph, nodiagnostic)
I wanted to get the forecast from period 171 to period184, so I set forecast=14. I just thought [71:170] was the sample data which were used to estimate parameters, but after running the command, I got a 100*14 matrix in the oo_.MeanForecast.Mean. I checked the manual, but I was not sure if I got the right meaning.
the first row means that dynare uses only one perid data(period 71) to forecast [171:184] data. then the 2nd row means that dynare uses 2 period data(from 71 to 72) to forecast [171:184], then 3rd row uses 71:73] to forecast [171:184] and the last one uses [71:170]to forecast [171:184]. Am I right?
Then when I caculate the RMSE, I just need use the last one? I do not know how to use these data to get RMSE as the same as SW2007.
Thank you for your help.
What exactly are you trying to do? With nobs=[71:170] you run 100 estimation samples starting with observation 1 to 70 and then 1 to 71 etc. If you want 71 to 170, you need first_obs=71 and nobs=100
Thank you, professor Pfeifer.
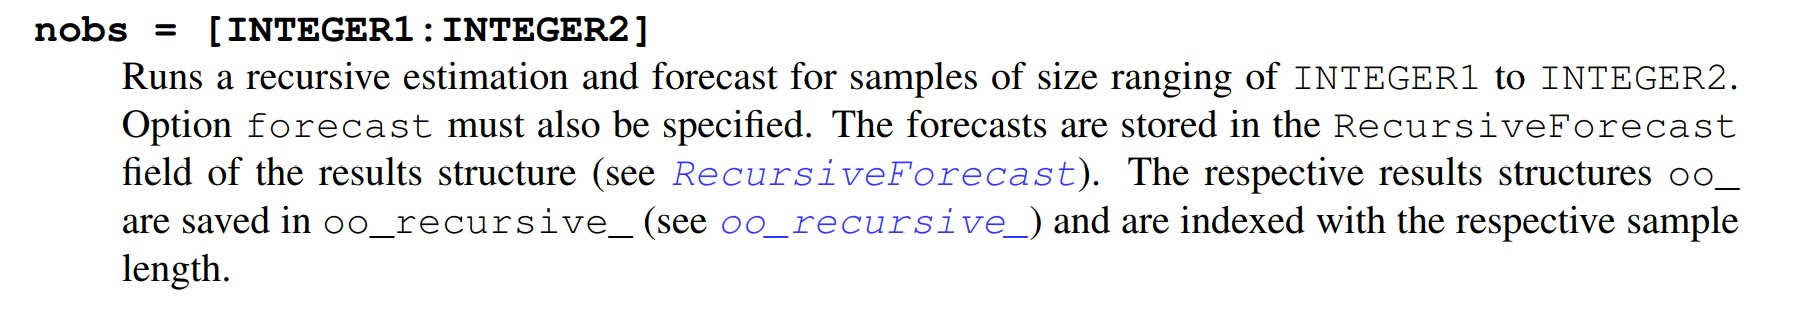
I am trying to do the recurisive forecast. As is shown in the manual below,I should set nobs=[a:b], and forecast=n.
Did I misunderstand this instruction?
Then I don’t understand your problem. How is Dynare’s behavior different from what you are trying to do?
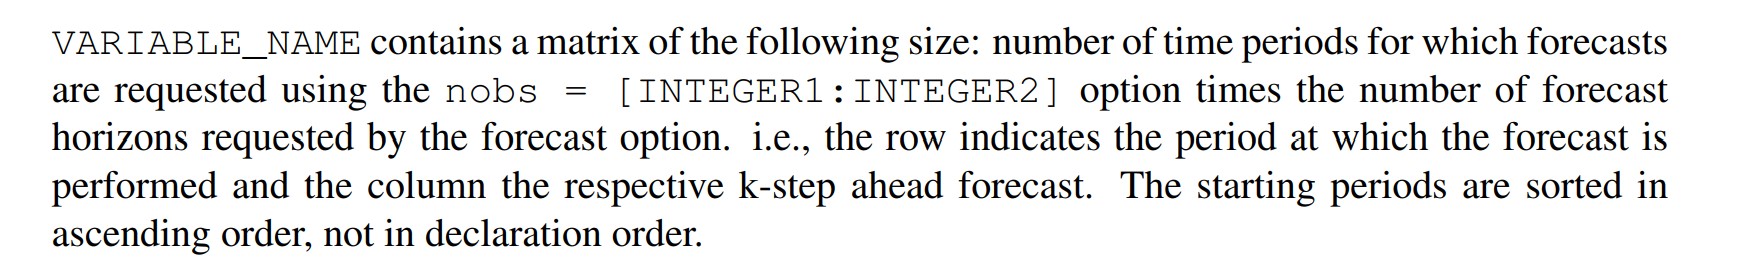
I don’t understand what the 100*14 matrix means, where is the period 171 to 184’s forecast result. It is a matrix, which row is the 171 to 184’s forecast result? I want to compare it with actual data to calculate RMSE.
The 100*14 matrix is the 1 to 14 step-ahead forecast (along the columns) for the 100 different terminal periods for which the model has been estimated, i.e. 71 to 170. Put differently, the first column contains the forecast for periods 72 to 86, made at time 71, the second column contains the forecast for periods 73 to 87, made at time 72, and so on.
I got it. Thank you so much, Professor Pefeifer.
Dear sir,
I have a confusion since you mentioned
The 100*14 matrix is the 1 to 14 step-ahead forecast (along the columns) for the 100 different terminal periods for which the model has been estimated, i.e. 71 to 170. Put differently, the first column contains the forecast for periods 72 to 86, made at time 71, the second column contains the forecast for periods 73 to 87, made at time 72, and so on.
Can you please clarify to me that while running this estimation, how can we find the true values for the 14 step forecast, because if first terminal that 71 is producing 72 to 86 forecast, and 170 (100th terminal period) will produce 14 forecasts from 170 to 184; Where from we get the 14 true values for 170 to 184 forecast to calculate RMSE, because our original sample is only upto 170.
thanks