Hello everyone,
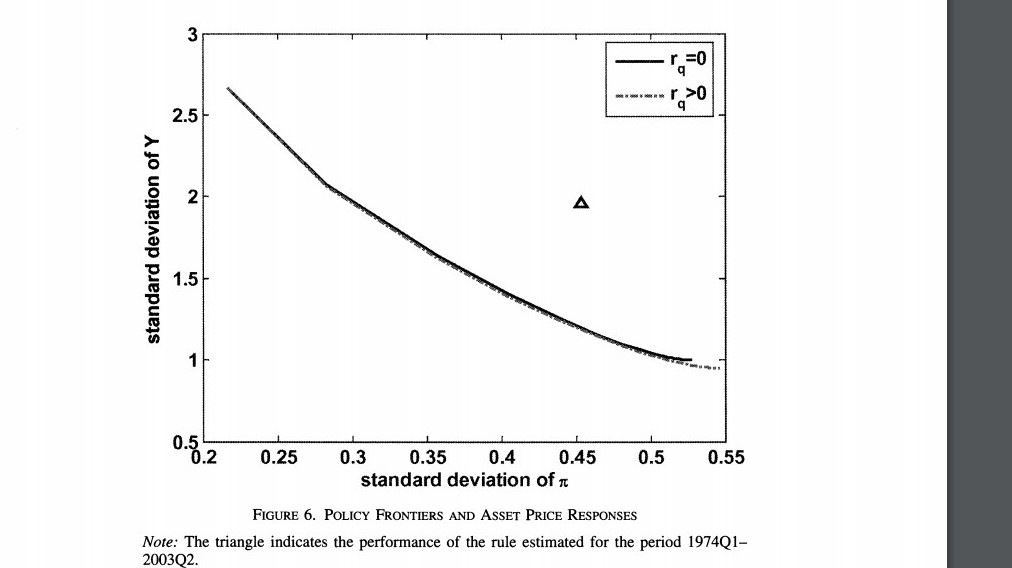
I am a new to both MatLab and Dynare. For a research project, after estimating a small open economy DSGE model, I am doing an optimal monetary policy exercise where I trace out an efficient policy frontier for output and inflation variation. After searching this forum I was able to find some code provided and was able to construct and plot the frontier on a graph. However, I am not sure how to also plot on the graph the output and inflation variation that results from the actual realized policy performance of the central bank from the estimated Taylor rule in the model. This is so I can compare the performance of the realized policy to the frontier to evaluate the performance of the central bank, as for example is done in Iacoviello(2005).
I have uploaded my mod file. Any help would be much appreciated!
soedsge_optimal.mod (3.4 KB)