I want to get the table as the attachment (which is displayed in Iacoviello(2010)) and I’ve got a few questions:
(1) After bayesian estimation( using data detrended by one-sided HP filter), I use posterior mean and command as ‘‘stoch_simul(order=1,irf=40,periods=10000,hp_filter=1600)’’, and then I get results e.g.
MOMENTS OF SIMULATED VARIABLES (HP filter, lambda = 1600)
VARIABLE MEAN STD. DEV. VARIANCE SKEWNESS KURTOSIS
y 2.707901 0.078555 0.006171 0.034046 -0.022127
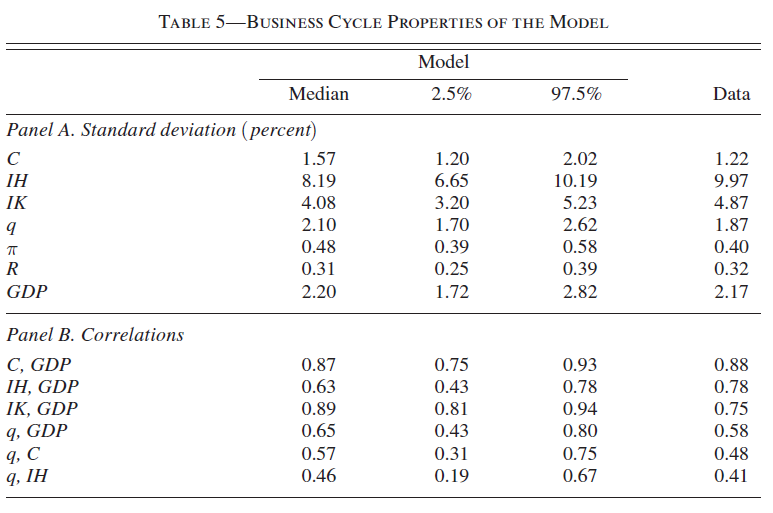
The value in "STD. DEV. " is just what I need in Panel A of the table. Is that correct ?
(2) And how should I get the value of confidence interval in that table then?
(3) I calculate the standard deviation of data series which are used for bayesian estimation. Is that the way I get the last column in that table ?
(4) What if one of the data series has missing observations, e.g. one is from 2000-2018 while others are from 1990-2018 ? I search the forum and find that the missing observations can be replaced as NaN when doing the estimation, but how can I calculate the standard deviation of this series ? ( if these NaNs have a real value created by Dynare, where should I find them ?)
(5) I could also get “VARIANCE DECOMPOSITION SIMULATING ONE SHOCK AT A TIME (in percent) (HP filter, lambda = 1600)”. What is the difference between this and VARIANCE DECOMPOSITION displayed when “periods=0” ? Which one should I use ?
Thank you for your time ! Any replies will be appreciated.
Best regards
No, that would be the standard deviation at the mean parameter draw.
You need to use the moments_varendo option, which will give you the median as well as the HPDIs for the values.
Yes, that should be the value.
You can only compute the empirical moments on the data you have. For the model, if you use NaN for those observations, you will still get theoretical model moments.
You specified the periods option, in which case you will get simulated moments. If you use periods=0, you will get theoretical moments. I would go for the latter one.
To the 4th question, Do you mean that I can do the estimation by using one data sseries from 2000-2018 and others from 1990-2018 while calculate the standard deviation and correlations with all series from 2000-2018 ?
Consistently use the same sample, which boils down to using the shortest available sample.
Use the longest available sample, i.e. standard deviations and pairwise correlations are based in different sample lengths.
Which of the two you use is up to your preferences.
Sorry to bother again, and I’m still a little confused about the 2nd question.
I add moments_varendo option in to the estimation command and find the results stored in “oo_.PosteriorTheoreticalMoments”. I have searched the forum related to this option while still got some questions:
(1) I want to get the 2nd column of that table. Take output “y” in my model as an example, I get “oo_.PosteriorTheoreticalMoments.dsge.covariance.Median.y.y” = 0.0915. I think it’s the variance of y so I calculate 0.0915^0.5=0.3025. Is this the std that I want ?
(2) It seem a very large number as the std of data series y_ob ( log of real GDP data and already filtered by One-sided HP filter) I used for bayesian estimation is about 0.0085. Did I do something wrong ? Why the two values so different ?
P.S. My observation equation is set as “y_ob= y - steady_state(y)” and the model-block is in log-level form as exp(variable).
(3) I checked the related context In Iacoviello(2010), and found the annotation about that table says:
“The statistics are computed using a random selection of 1,000 draws from the posterior distribution and, for each of them, 100 artificial time series of the main variables of length equal to that of the data, giving a sample of 100,000 series. The business cycle component of each simulated series is extracted using the HP filter (with smoothing parameter set to 1,600). Summary statistics of the posterior distribution of the moments are computed by pooling together all the simulations.”
What are the options in the code of Dynare that reflect this “1,000 draws” and “100 artificial time series” ? What command do they use to get the results in that table ?
I tried variable y_ob and still it has much larger variance than that of actual data. This situation seems quite unusal as I set the observation equation as"y_ob= y - steady_state(y)". Why the std of actual data y_ob is so much smaller than the variable y_ob matched in the model ? Did I misunderstand something ?
(The estimation results of the model are all seem good, i.e. mode plot, convergence , acceptance ratio)
The actual data is manually filtered by One-sided HP filter, but how should I deal with the value of moments stored in i.e.“oo_.PosteriorTheoreticalMoments.dsge.covariance.Median.y_ob.y_ob”?
I searched posts related to “posterior predictive moments”, which seems a little complicated for me. What’s the difference between this and the results of moments_varendo option ? Are both of them OK for the purpose of estimation evaluation ?
Thank you for your time! Really appreciate your kindness!
Best regards