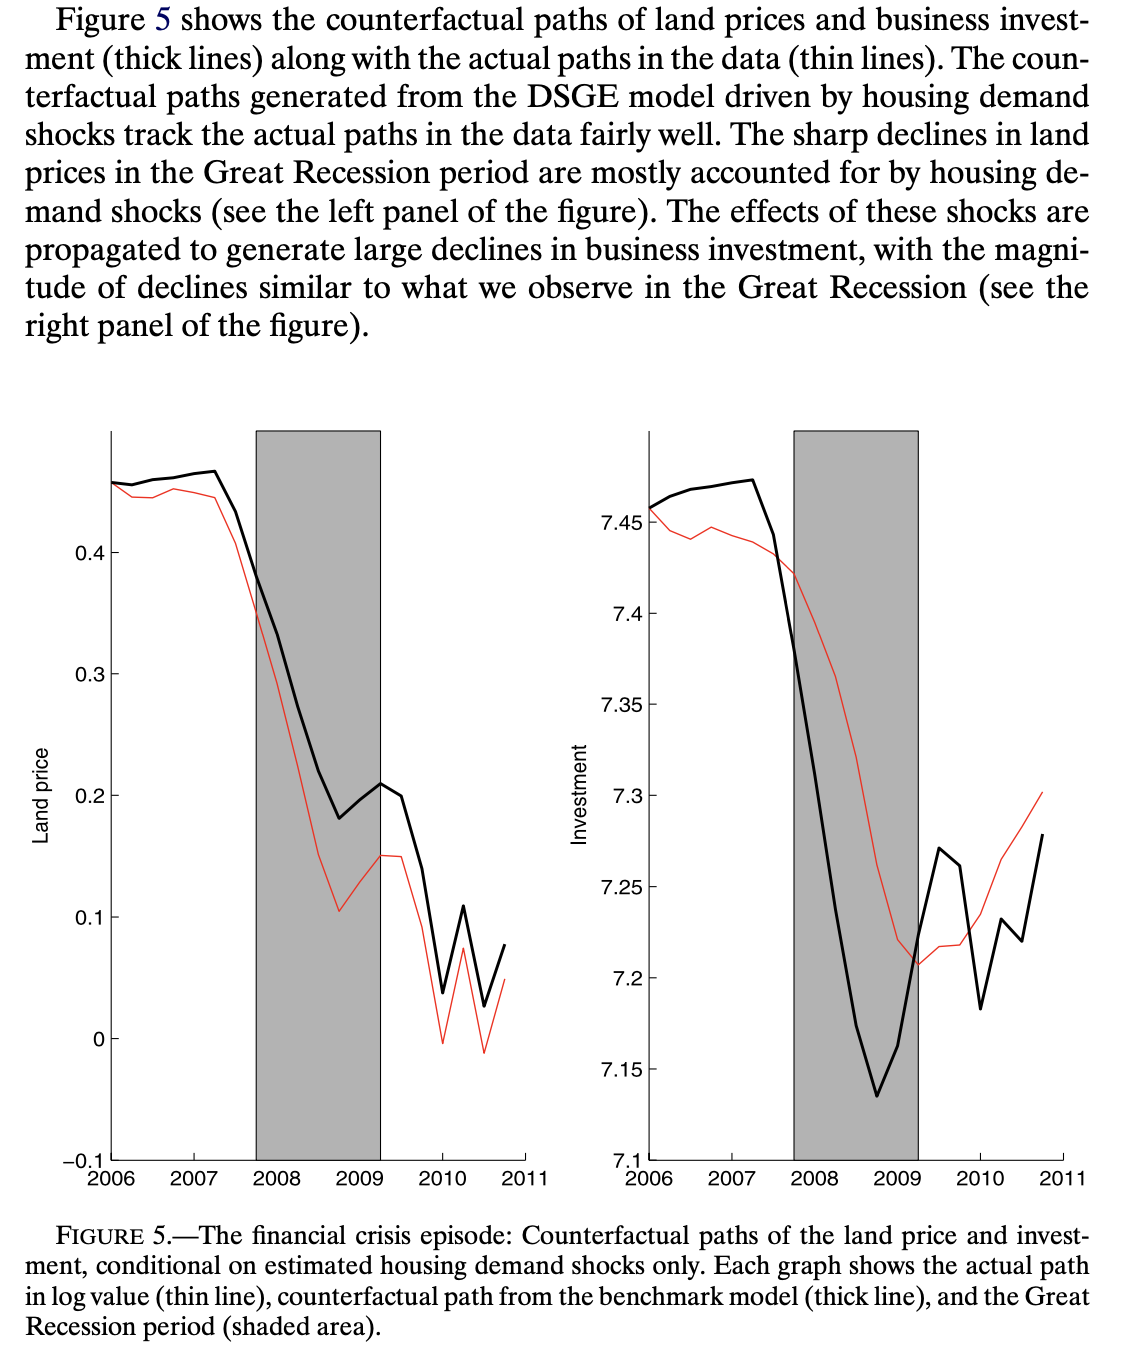
Hi Prof,
I’m trying to replicate Liu, Wang and Zha (2013, Econometrica). But I don’t quite understand Figure 5 in their paper. How are the two lines obtained?
-
In their paper, the black solid lines are observables. So we can easily get them in dataset. But What if black solid lines are non-observables, say GDP or interest rate? Should I use smoothed variables?
-
How are the red thin lines obtained? Through shock_decomposition command or some other options?
-
If these lines are obtained through shock_decomposition, then why they start at the same point in 2006Q1?
Thanks in advance!
Here are Figure 5.
and the paper LWZpaper-2013-Econometrica.pdf (497.9 KB)