I have encountered a problem when doing the the comparison of irfs in two models. The only difference between the two models, for example, is the consumption tax: one model has no consumption tax and the other one has.
I found that when I add the consumption tax into the benchmark model, the steadystate has already changed. It seems that I can not just compare the irfs of the two models directly as the irfs are base on different steadystate. Then, how can I do the comparison if I want to know the impact of this consumption tax ?
Hope you could give some advise. Thank you very much .
I am not sure I get the question. IRFs give you impulses relative to steady state. That the steady state is different need not be a problem. It depends on what you are interested in.
Actually I want to analyse the policy effects of property tax.
So I write a model without property tax as the benchmark, and do the calibration and bayesian estimation.
And then I add the property tax into the benchmark as a comparison model.
Keep all the parameters unchanged, I compare the irfs of the two models under the housing demand shock.
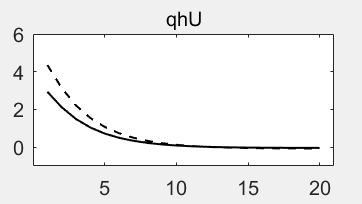
I plot the irfs of the two models in the same picture and found that the deviation of house price from its steady state in the model including property tax is much greater than the benchmark.
It looks as the following picture. The solid line is benchmark and the dash line means the one with property tax.
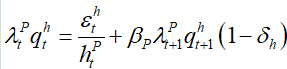
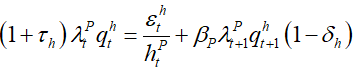
I don’ know how can I explain this result. As shown from the Euler equation of housing demand as follows, it seems that the deviation of house price should be decreased.
epsilon_h represents the housing demand shock.
Did I have some misunderstanding? How should I explain this greater deviation of house price?
Any reply will be helpful. Thank you very much!
Sorry, but I don’t know your model. The tax will presumable put a wedge between supply and demand and will affect the intertemporal margin it seems. That may cause some of the bigger swings. Also, does the price fluctuate more in absolute or only relative terms?
Do you mean that
although the greater deviation of house price is displayed in the model with property tax, yet the absolute house price rising may not greater than the benchmark ?
Could you please tell me how to plot the absolute fluctuation visually in Dynare?
And also I sincerely want to comfirm whether this kind of comparison could help analysing the effects of property tax or not ?
Looking forward to your reply. Thank you for your time !