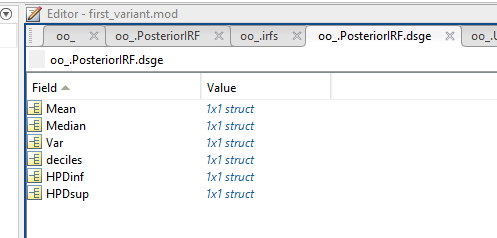
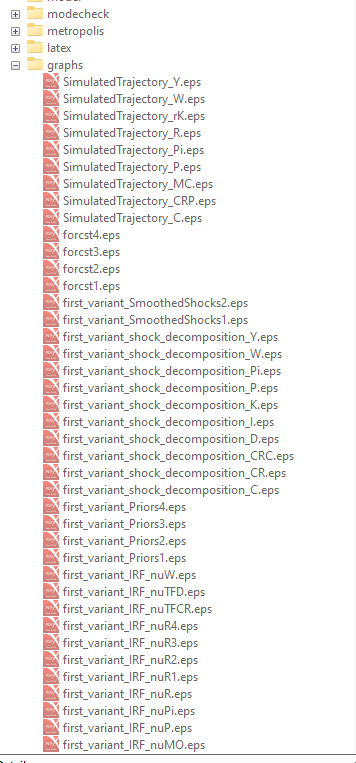
Hello! After Bayesian estimation of the DSGE model according to the standard, a number of graphs should be displayed. However, I only get the mod_check graph, the MCMC convergence criterion and that’s it. Where is the rest? I enter the following code
estimation(
    order=1,
    datafile='...',
    xls_sheet=FinalData,
    xls_range=B1:P56,
    prefilter=0,
    mh_replic=20000,
    prior_trunc=0,
    first_obs=1,
    lik_init=4,
    mh_nblocks=8,
    mh_init_scale=0,
    mh_jscale=0.01,
    mode_check,
    mode_check_symmetric_plots=1,
    mode_compute=5,
    consider_only_observed,
    mcmc_jumping_covariance=identity_matrix,
    keep_kalman_algo_if_singularity_is_detected,
    kalman_algo=0,
    use_univariate_filters_if_singularity_is_detected=1,
    rescale_prediction_error_covariance,
    diffuse_filter,
    bayesian_irf,
    irf=50,
    relative_irf,
    filtered_vars
    forecast=4
    );
but nothing is displayed on the screen, although Matlab reports a successful evaluation of the model. Maybe these graphs should be stored separately somewhere? Or am I doing something wrong?

