Hello, everyone.
I am trying to estimate the semi-structural model below in Dynare, but I get the error message below.
error: makedataset: I can't find a datafile (with allowed extension m, mat, csv, xls or xlsx)!
error: called from
    makedataset at line 106 column 13
    dynare_estimation_init at line 386 column 26
    dynare_estimation_1 at line 119 column 93
    dynare_estimation at line 105 column 5
    driver at line 1125 column 14
    dynare at line 310 column 5
I am running the model in Octave using a CSV data file that is in the same folder as the model file.
Could someone help me?
PS: I also used a .m file as shown in fs_2000 example model. Error below:
error: 'economic_data' undefined near line 1, column 1
error: called from
    load_m_file_data_legacy at line 32 column 1
    makedataset at line 124 column 22
    dynare_estimation_init at line 386 column 26
    dynare_estimation_1 at line 119 column 93
    dynare_estimation at line 105 column 5
    driver at line 1125 column 14
    dynare at line 310 column 5
If you could help me, I appreciate.
economic_data.m (9.4 KB)
economic_data.CSV (20.0 KB)
modelo_tent_2.mod (6.0 KB)
For me, it seems to work. Did you put the three files in the same folder?
However, it is written:
OPTIMIZATION PROBLEM!
 (minus) the hessian matrix at the "mode" is not positive definite!
=> variance of the estimated parameters are not positive.
You should try to change the initial values of the parameters using
the estimated_params_init block, or use another optimization routine.
Warning: The results below are most likely wrong!
Thank you for the response.
The files are in the same folder.
I have installed the latest version of the IO package for Octave.
I really don’t know what is happening with regards to reading the data file.
Regarding the warning you encountered, I really don’t know how to resolve it. Could someone please help? I would greatly appreciate it.
I see. I was using Matlab. So it could something related to Octave. We will need to be patient and wait for someone who knows more!
By the way, do you have more information about the distributions of the parameters because all of them follow a uniform distribution of either 0 and 1 or 0 and 10?
No. I do not have any information about the parameters. Is there another way to estimate the parameters of the model (other estimation technique, other estimator etc)?
I can run your file in Octave 8.4 together with Dynare 6 without any error message.
Thank you for your reply.
I tested other files. Some open and others do not (I have the latest (stable) versions of Dynare and Octave).
I am using MATLAB now and everything works.
Regarding Bayesian estimation: I watched your (Professor jpfeifer) video on YouTube about Bayesian estimation in Dynare. I understood that optimization depends on the distribution and initial parameter values.
In my code, optimization was not possible. I saw on the forum that it is possible to estimate processes with a unit root. Do you (or any kind soul who wants to help) have any tips on how to find initial values and distributions so that the estimation can be successful?
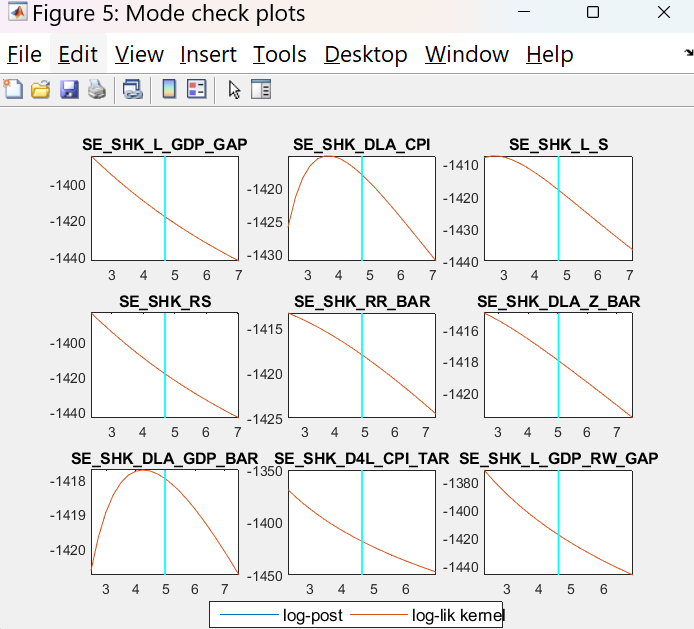
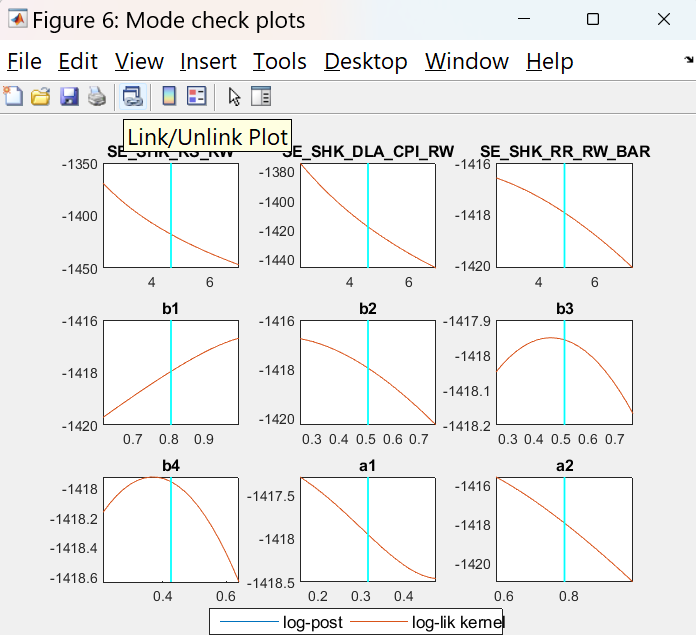
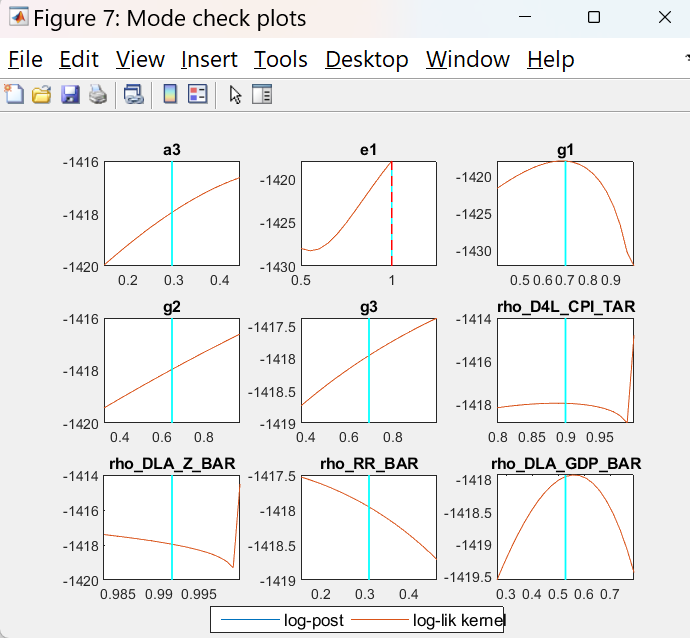
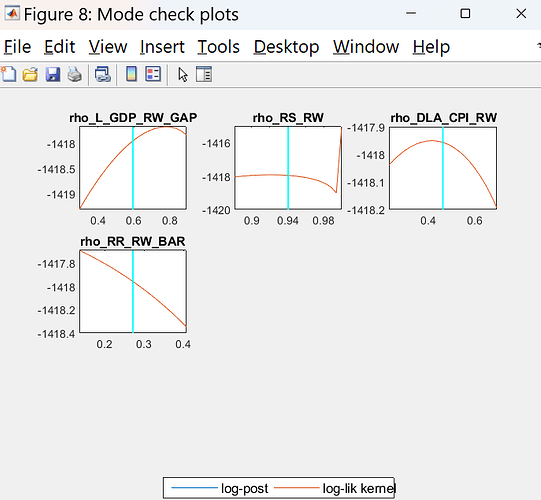
Did you inspect the mode_check plots?
The figures with the graphs are presented below.
I did not understand the meaning of the results. Could you please inform me how to interpret the graphs?
That looks bad. Which mode_compute did you use?
Command used
estimation (datafile=economic_data, graph_format = pdf, nodiagnostic, diffuse_filter, mh_drop=0.5, mh_jscale=0.2, mh_replic = 0, mh_nblocks = 2, filtered_vars, smoother, mode_compute = 4, mode_check, plot_priors = 1, forecast = 0);
I used mode compute 4: Uses Chris Sims’s csminwel
I guess I would need to see the files.
Files attached below.
economic_data.m (9.3 KB)
modelo_tent_2.mod (6.2 KB)
Indeed, this is a problem, as I cannot find a way to remove the trend.
One of the model’s variables is L_GDP, which is the logarithm of GDP, and it has a trend. This variable has two components:
L_GDP_GAP, which is the GDP gap, and L_GDP_BAR, which is the GDP trend. Both L_GDP_GAP and L_GDP_BAR are used in the model’s equations.
I read the article “A Guide to Specifying Observation Equations for the Estimation of DSGE Models” and tried to modify the model. But I confess I couldn’t do it. Could you give me a hint on where to start modifying the model to remove the trend? There are also variables like L_S (exchange rate) and L_CPI (consumer price index), which have a trend and appear in the model’s equations.
I am very grateful for your patience and the time you have spent answering my questions.
Usually, you would e.g. use growth rates as observables and then match them to the variables in the model.
Professor @jpfeifer
Thank you for your response, professor.
I truly appreciate your time and patience. It took me a while to write back because I am trying to understand this new area of study for me.
While searching for more information on this forum, I accessed the link A nonstationary model for output gap with a const in drift and saw a non-stationary model that has an observable variable with a trend. In this situation, the Bayesian estimation and Kalman filter calculations worked correctly. I will leave the files of the model presented in the link here. I honestly would like to try to understand what is happening.
Data_LV_2.xlsx (123.1 KB)
lv_gdp_data.m (542 Bytes)
modelo_gin_2.mod (3.4 KB)
The big difference is that @gin’s file provided an analytical steady state to be used. You only provide initial values.
If you know what you are doing, you can just work with the provided values and disable the check. The attached file returns OK looking mode_check-plots
modelo_tent_2.mod (6.2 KB)
But be careful that any wrong initial value provided may result in wrong results.
Thank you, professor, for your help.
I took a while to respond because I am studying to better understand what is happening. I am new on this subjetct of economic modeling.
Maybe now I can formulate a better question.
If you allow me, I would like to ask one more question, now with a simpler model (which might help me with the more complex model).
Imagine that I have a nominal interest rate i, an inflation target \pi_{tar}, and a modified real interest rate rr (which is not exactly nominal interest minus inflation but tends to approach this). The real data show that both the i series and rr are not stationary. Based on the above information, the model follows (in “pseudocode” or “incomplete” code):
var i rr pi_tar rrtrend rrpers Drrtrend;
varexo eps_i eps_pi eps_trend eps_pers;
parameters theta_1 theta_2 rho gamma pi_ss drrtrend_ss

theta_1=0.5;
theta_2=0.2;
rho=0.8;
gamma=0.85;
pi_ss=3;  % long term inflation target
drrtrend_ss =2;  %long term rr rate trend

model;

i=theta_1*i(-1)+theta_2*i(-2)+(1-theta_1-theta_2)*(rr+pi_tar)+eps_i;
pi_tar=rho*pi_tar(-1)+(1-rho)*pi_ss+eps_pi;
rr=rrtrend+rrpers;
Drrtrend=rrtrend-rrtrend(-1);
Drrtrend=gamma*Drrtrend(-1)+(1-gamma)*drrtrend_ss+eps_trend;
rrpers=rrpers(-1)+eps_pers;

end;

and so on...
If I use growth rates for the interest rates (change the expression rr=rrtrend+rrpers; to growth rates and expressions below in the code), Dynare runs the program smoothly. The problem is that I want to evaluate scenarios that involve the variables at their levels, not at growth rates. I need at least 𝑖 to be given in levels.
I know that to have i in levels, I need rr to be expressed in levels, but I can’t understand how to create an expression that transforms growth into levels without causing errors in the code.
Is there any mathematical tip or clue on how to solve this?
Moreover, from what I understand, observable variables that have a trend must be specified in terms of growth rate to allow for proper estimation, based on previous responses. This leads to the same problem, because if I include the growth of rrtrend as one of the observable variables, the difficulty in extracting
in levels without causing an error in Dynare remains.
I am not sure I fully grasp the problem. The only difference between growth rates and levels is information about the first period level. Depending on what you are trying to do, you could cumulate the growth rates based on your knowledge of the initial value. Also, in the model above, you will get smoothed estimates of the level i, usually starting from the initial value you provided.
That being said, the diffuse_filter should allow you to estimate and filter a model in levels as well.


