Hi! Can you help me with these charts? what are the variables denoted by the greek letters? how do you read the pictures? this is a DSGE model from Gertler and Karadi 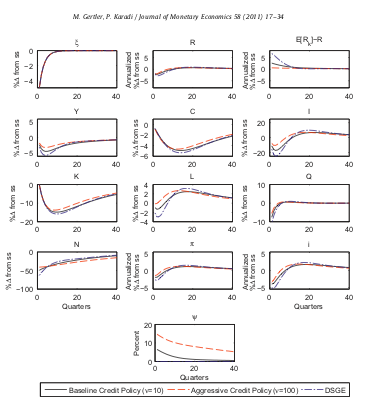
Hi dashain,
I found these explanations of the greek letters in the paper:
-
Accordingly, suppose the central bank is willing to fund the fraction \Psi of intermediated assets:
-
where \delta(U_t) \xi_t K_t is the quantity of capital refurbished
For the IRF’s, they are the responses of endogenous variables to some sort of unexpected shock. Which one is not clear from the picture you are showing here, but I am sure the authors explain it in the paper.
1 Like
yes, sure, but how do you read the results that come out of a generic dsge model? in this case how would you read these results?
Is π the inflation rate?
Thank you so much.
Hi dashain,
yes, \pi is the inflation rate. How well do you know DSGE models in general? Just to be sure how to answer your question: how do you read the results that come out of a generic dsge model?. By read the results, do you mean how to interpret the IRF’s?
If yes, impulse response functions show the effect, and evolution, an unanticipated shock has on endogenous variables. In the picture you have posted, the plots are given as percentage deviations from the steady state of the variable in question. I.e., for whatever shock this picture is related to, for instance inflation decreases on impact by about 2% and then, within around 10 quarters, returns to its steady state level.
I hope this answers your question on how to read those results.
2 Likes