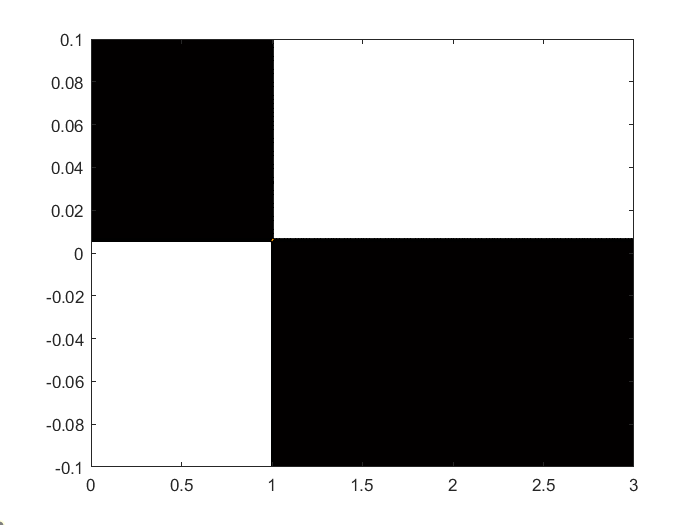
Hello. I want to draw determinacy region using a DSGE model. The relevant parameters are ‘phipi’ (Taylor rule sensitivity to inflation), ‘psib’ (Tax rule sensitivity to debt overhang), and ‘phiy’ (Taylor rule sensitivity to output growth).
I want to plot determinacy region where x-axis is ‘phipi’(from 0 to 3), y-axis is ‘psib’(from -0.1 to 0.1) under each given values of ‘phiy’. I plan to draw this determinacy region for 5 different ‘phiy’ values = [0, 0.5, 1, 1.5, 2].
I tried to follow ‘Ascari_Sbordone_2014.mod’ Figure 11 replication by Prof. Pfeifer but I ran a problem with a message :
Error using resol
Too many input arguments.
Error in aob_policy_regime.driver (line 613)
[dr,info]=resol(0,M_,options_,oo_.dr, oo_.steady_state, oo_.exo_steady_state, oo_.exo_det_steady_state);
Error in dynare (line 278)
evalin(‘base’,[fname ‘.driver’]);
Error in aob_policy_regime (line 2)
dynare aob_policy_regime.mod
;
I would really appreciate your comments. Thank you so much!
Best Regards,
Yoonhyok
aob_policy_regime.mod (13.0 KB)
aob_policy_regime_steadystate.m (6.5 KB)
solve_calibration.m (531 Bytes)
