Hi there, I just borrowed a script on Matlab from a friend to plot multiple IRFs on macroeconomic aggregates with variation on parameters values on a modified RBC model with an externality.
Basically, there are 4 sets of graphs:
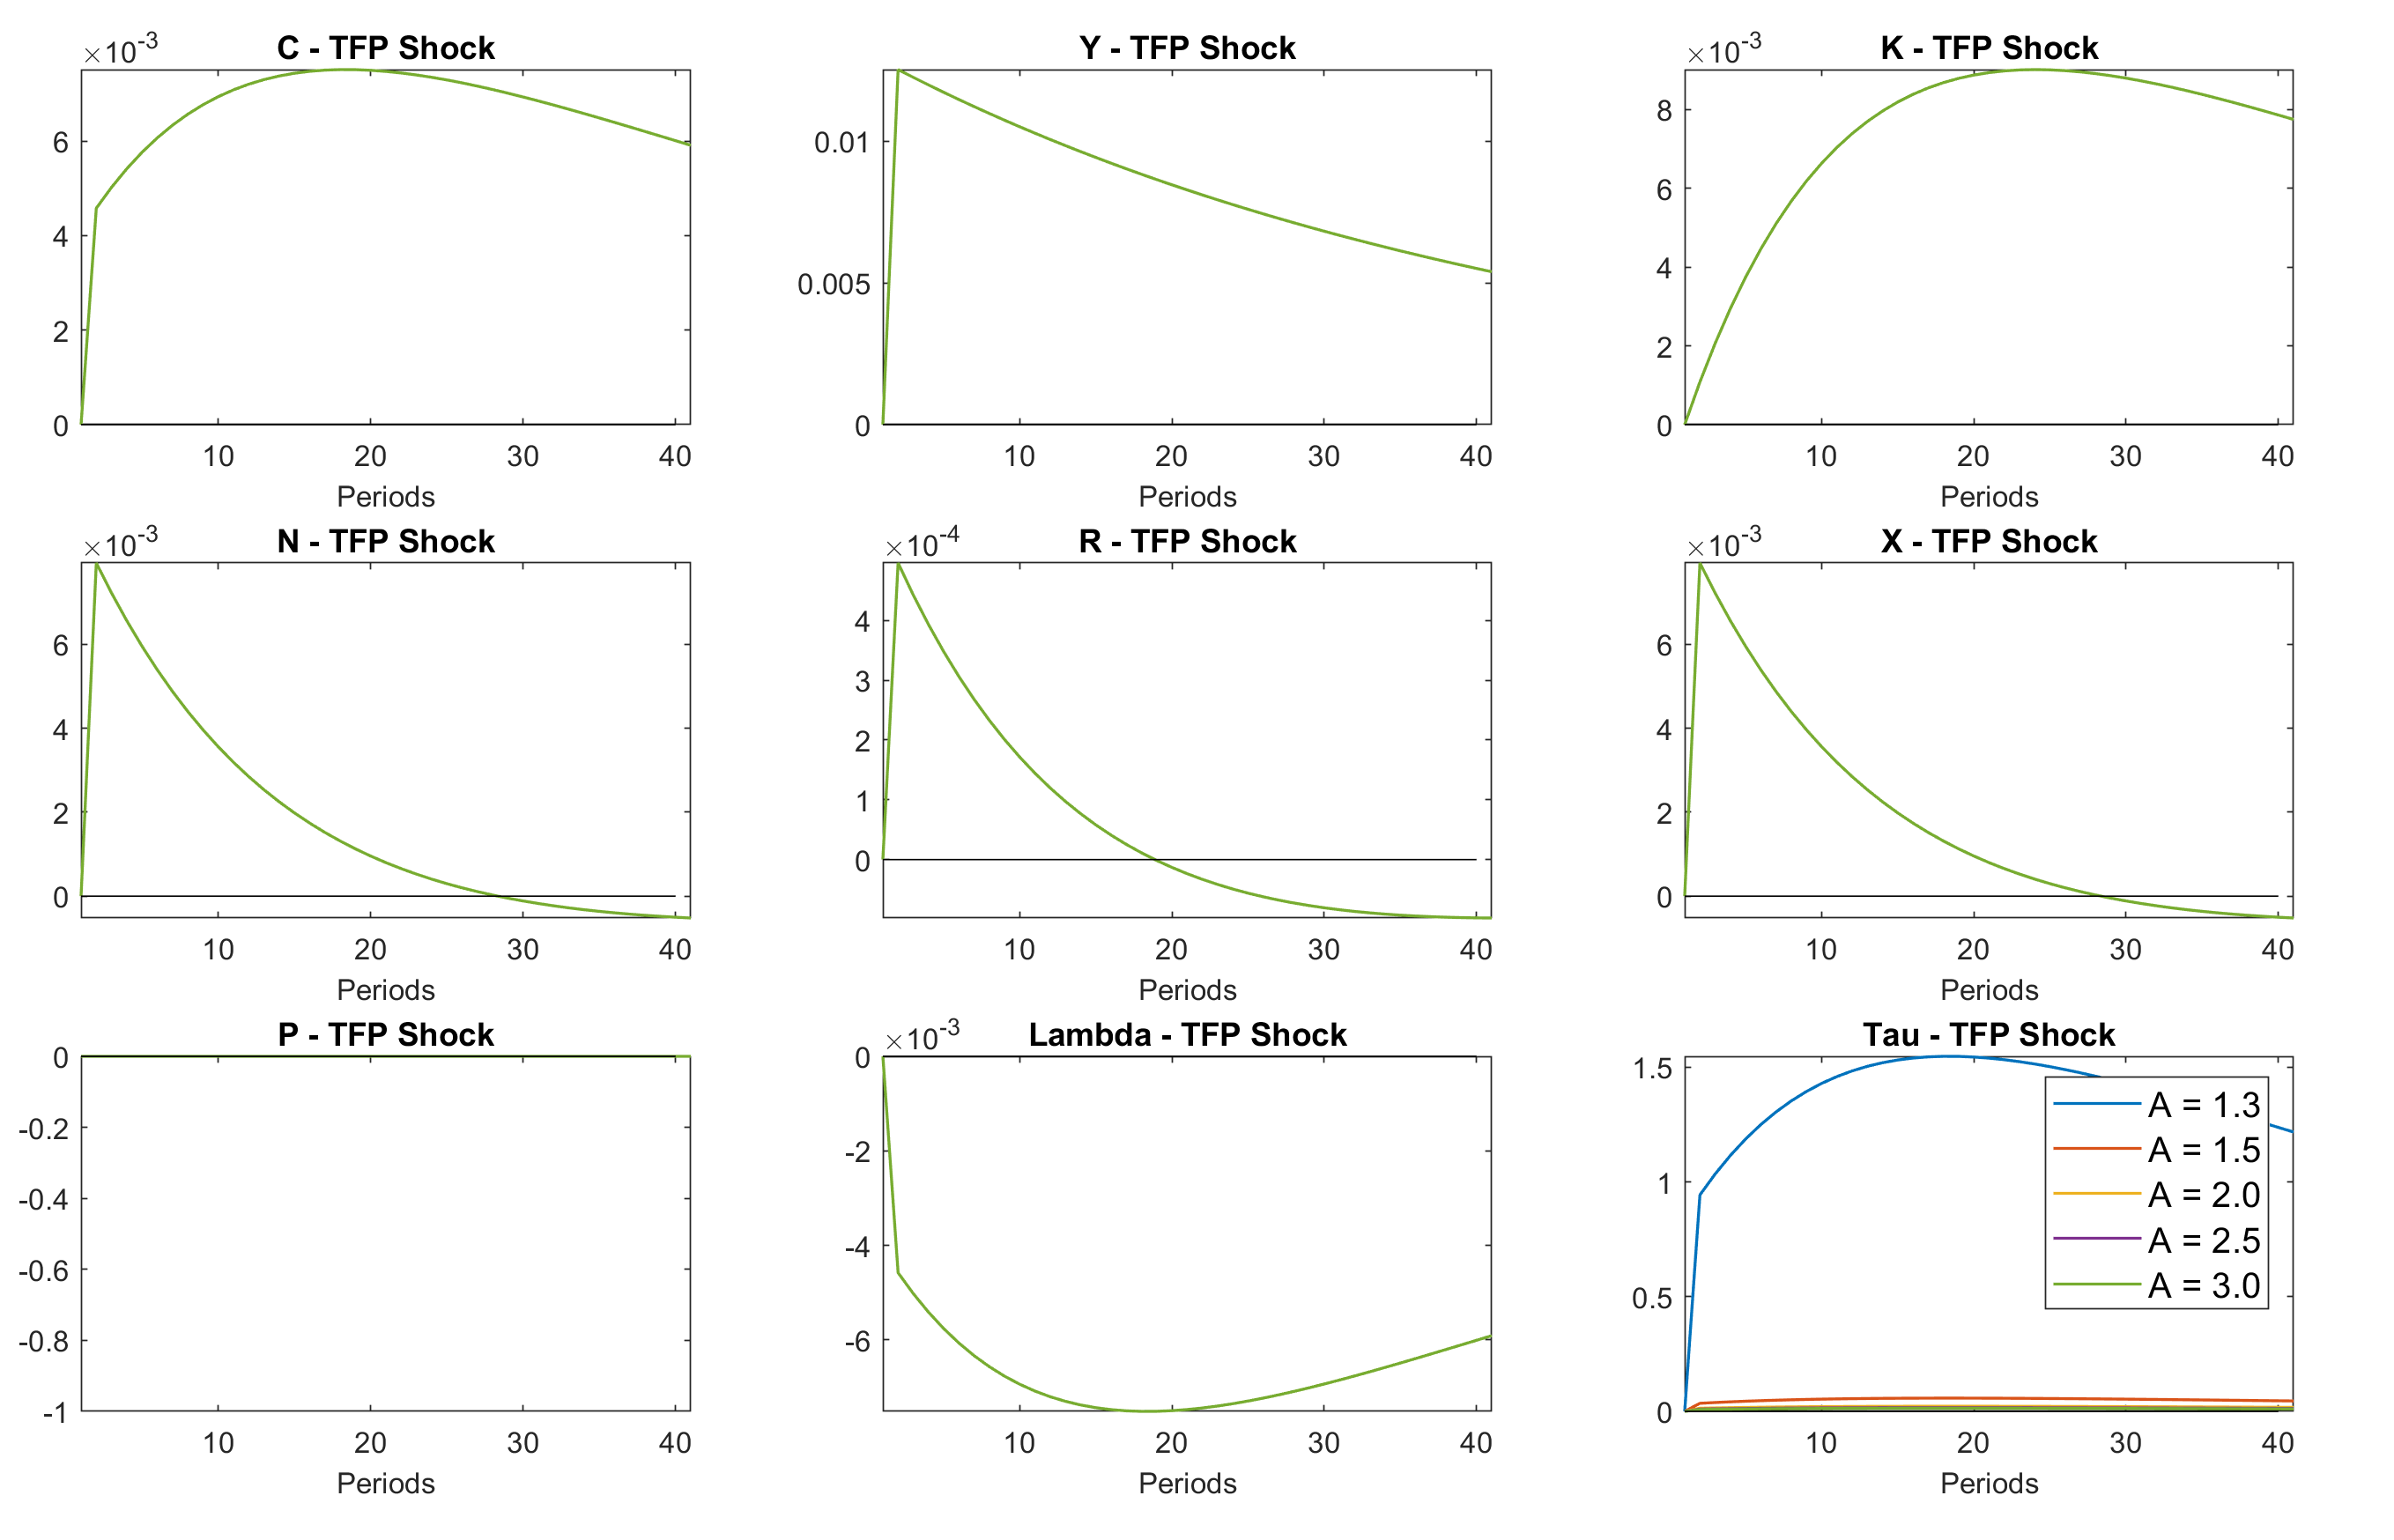
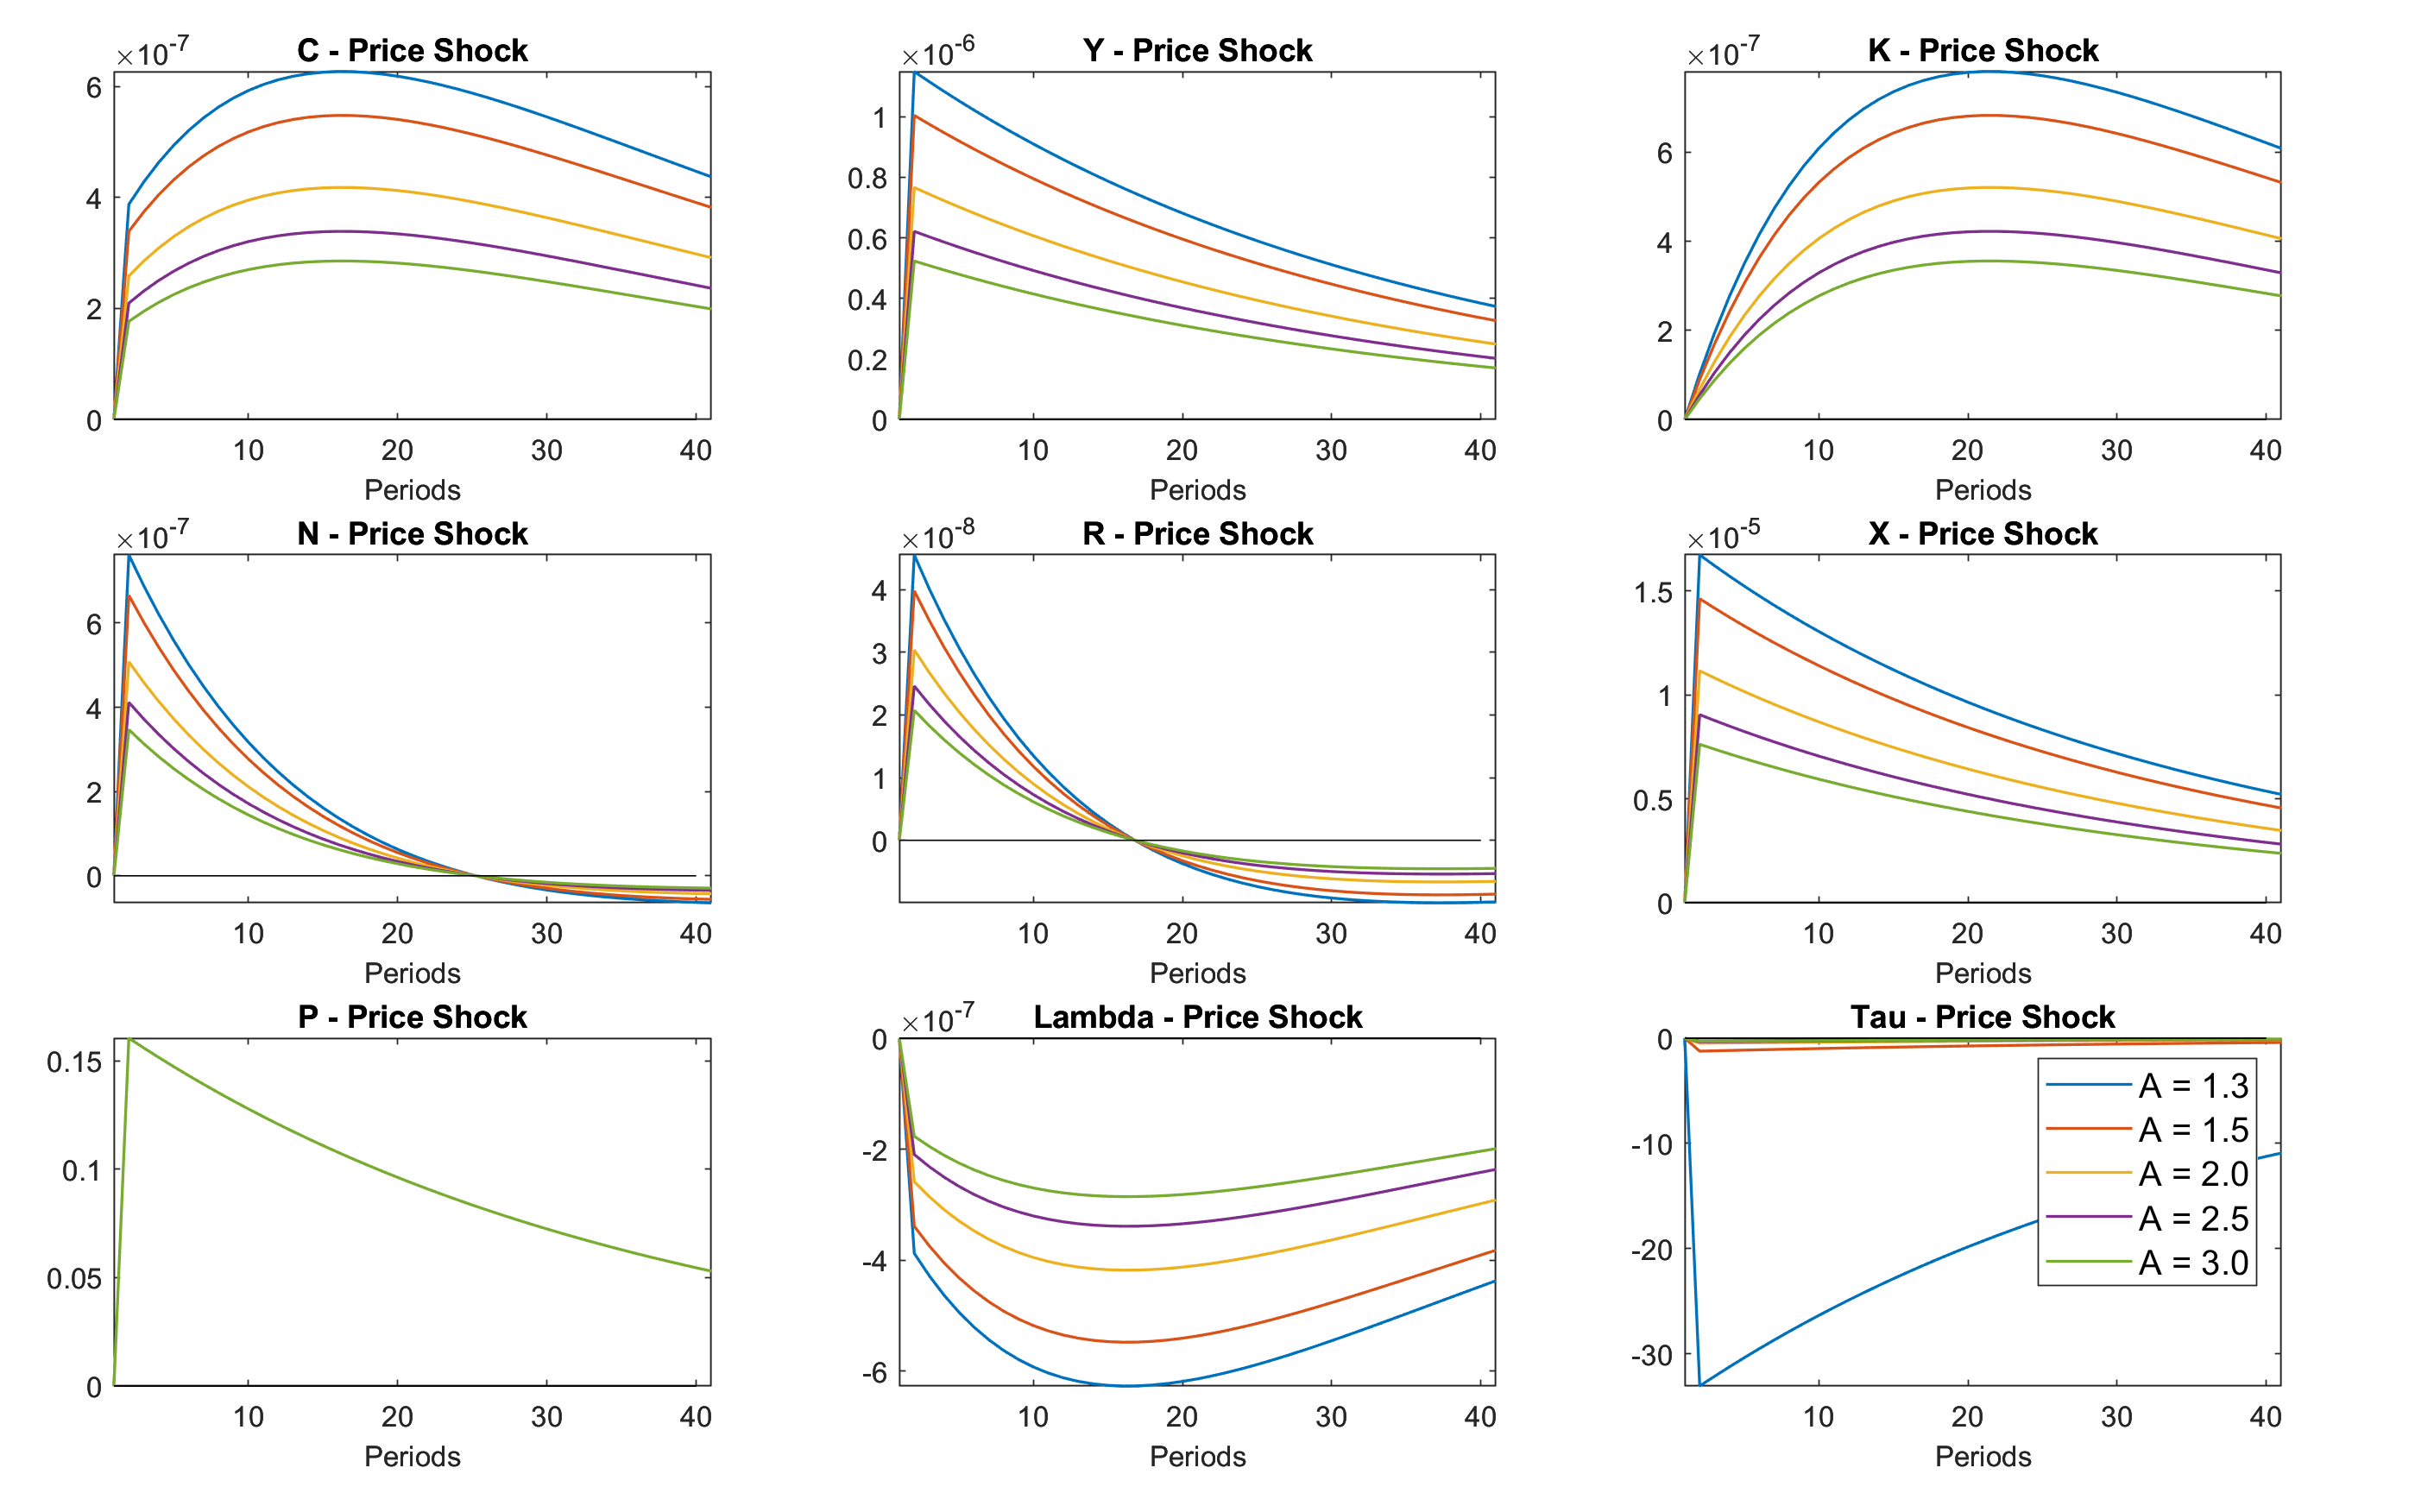
A- Variations on parameter (A): (1.3, 1.5, 2.0, 2.5 and 3.0)
1- TFP shock
2- Price shock
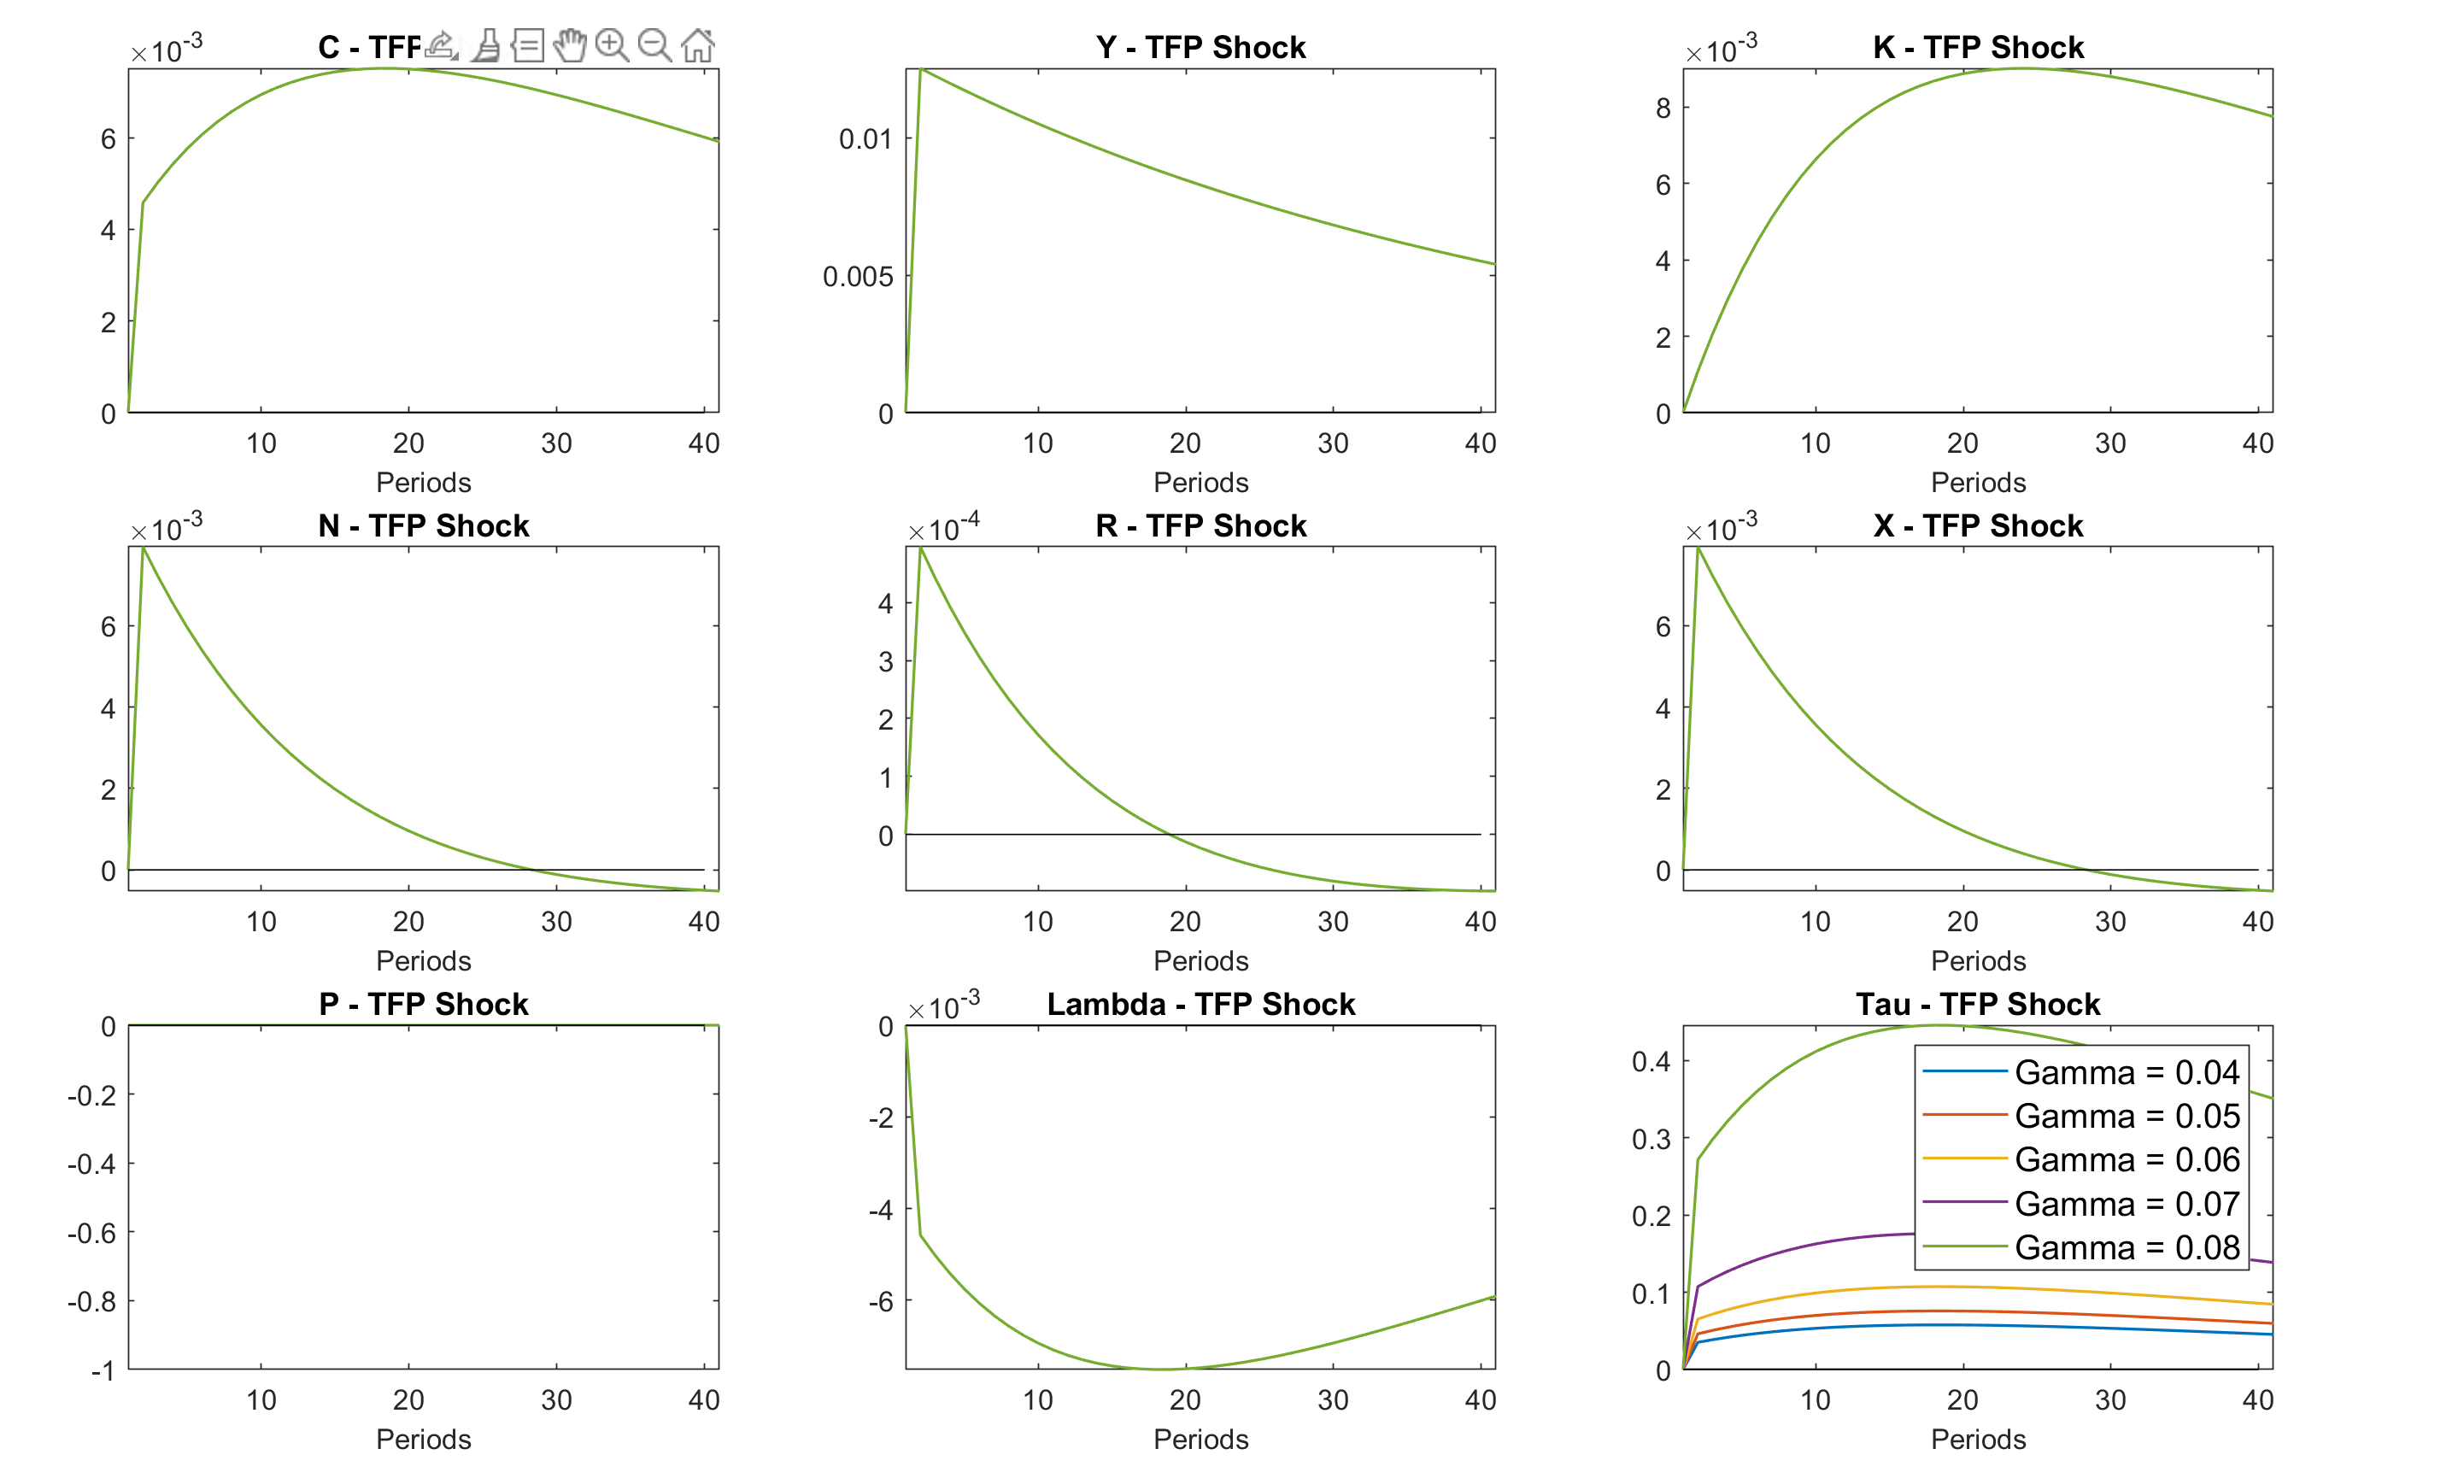
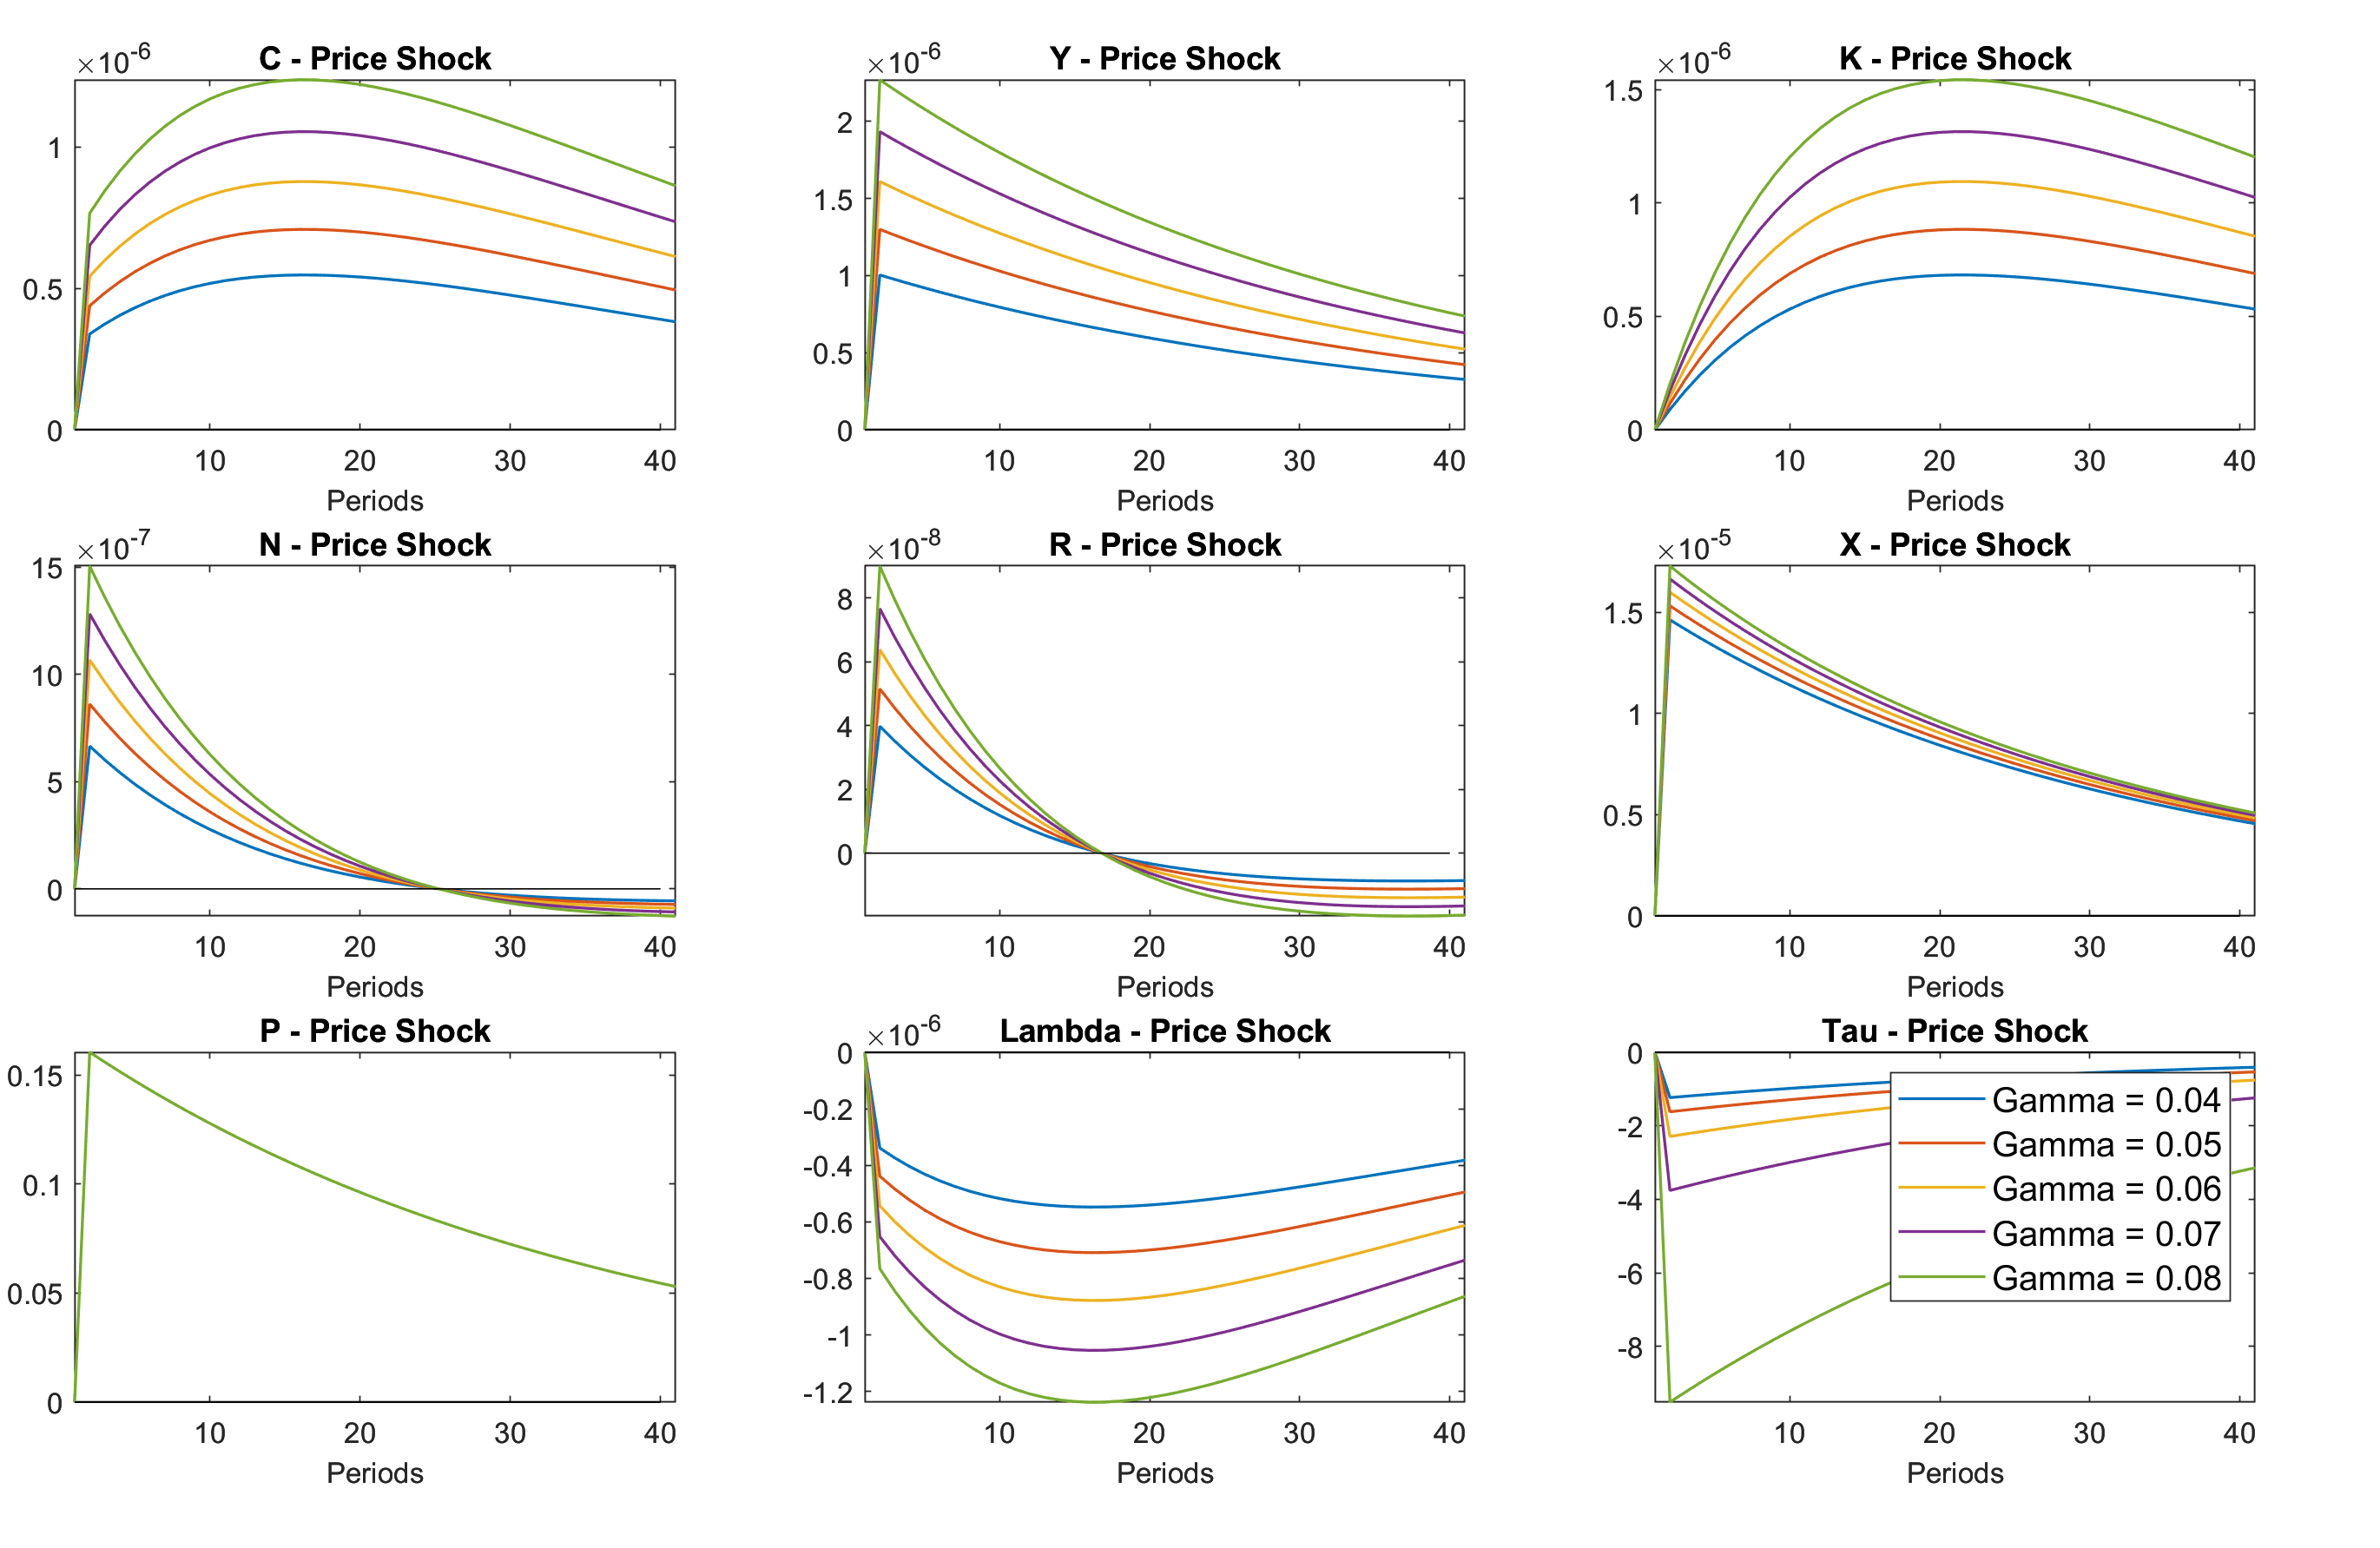
B- Variations on parameter (gama): (0.04, 0.05, 0.06, 0.07, 0.08)
1- TFP shock
2- Price shock
Files related:
1- Matlab Loop to plot IRFs
rbc_loop_x_withrobustness_FK.m (9.6 KB)
2- Dynare Files:
RBC Model no tax:
rbc_comp_e_notaxVF_NEW.mod (5.5 KB)
RBC model with tax:
rbc_comp_e_withtaxVF_NEW.mod (5.6 KB)
Robustness check parameter (A):
rbc_comp_e_withtaxVF_NEW_Arob.mod (5.7 KB)
Robusteness check parameter(gama):
rbc_comp_e_withtaxVF_NEW_gamarob.mod (5.7 KB)
On both cases, the graphs for the TFP shock does not show variations of the parameters (A) and (Gama), but for the Price shock it seems to work fine.
I would welcome any suggestions to make it work, it seems that TFP shock does produce variations for the chosen range of parameters (A) and (gama), perhaps the values for the macroeconomic aggregates are two small, not sure.
if you want try, start running the matlab file (from line 98 on), divided in blocks for robustness check of parameter (A): TFP and Price shocks and then, robustness check of parameter (gama): TFP and Price shocks.
Thank in advance for any comments or suggestions.
Kind Regards,
Felipe