Hello,
I am very new with Matlab and Dynare and I am struggling to get a nice plot for impulse responses:
I want to show in the same graph responses for 2 models (same, shock, same variables) where the only difference is a change in some parameters’ values.
Please, I would appreciate if I could get the code for this after stock_simul.
It would be great to know how to include variables names instead of getting shown in the plot the codes for each.
Example:
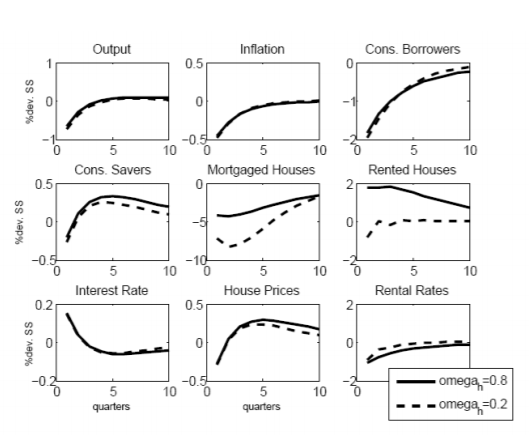 but as I said, there will be a change in more than a parameter.
Many thanks
I tried that code already and It does not work for me. It gives me error with the load function. This is what I have done:
Y runned the model: “dynare model1”
And then I followed the same code:
I am not sure whether I need to save first the matrix with the results. I am sure it is simple but I am really not familiarised with Dynare and I am struggling to find out what am I doing wrong.
Thank you
Does the file that you are trying to load exist in the folder?
Yes, it does. I saved them beforehand… I am getting confused
Just one question, do the impulse responses have to have mat format or m format? I saved them in both formats and it does not work either. That’s the error I get.
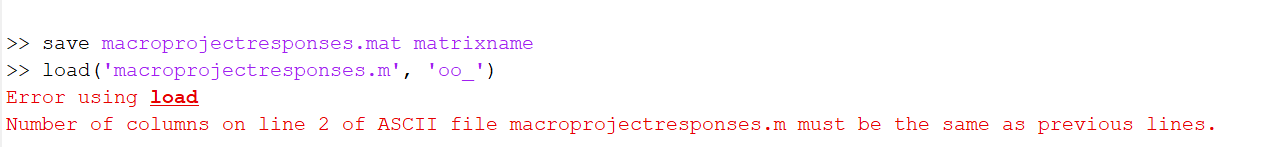
I used this code
dynare model1
matrixname = oo_.irfs
save macroprojectresponses.m matrixname
load(‘macroprojectresponses.m’, ‘oo_’)
and I got that error. What am I doing wrong? Many thanks
What you are doing is completely inconsistent. Matlab only loads mat-files correctly. But you are trying to load a variable named oo_ from the file, but you only saved a variable named matrixname.