Hi all,
I am working on estimation using Bayesian for a simple DSGE model.
I got the following errors. I have read most related posts about these errors but can not find where they come from. Any suggestions or comments would be grateful. Thank you, and have a nice weekend!
vina.m (2.0 KB)
working.mod (5.9 KB)
REDUCED-FORM:
!!!WARNING!!!
The rank of Tau (Jacobian of steady state and reduced-form solution matrices) is deficient!
[psi,kappa] are PAIRWISE collinear!
[rho,kappa] are PAIRWISE collinear!
[rho,psi] are PAIRWISE collinear!
SPECTRUM (QU AND TKACHENKO, 2012):
!!!WARNING!!!
The rank of Gbar (Jacobian of mean and spectrum) is deficient!
SE_eps_cp is not identified!
[psi,kappa] are PAIRWISE collinear!
[rho,kappa] are PAIRWISE collinear!
[rho,psi] are PAIRWISE collinear!
MOMENTS (ISKREV, 2010):
!!!WARNING!!!
The rank of J (Jacobian of first two moments) is deficient!
SE_eps_cp is not identified!
[psi,kappa] are PAIRWISE collinear!
[rho,kappa] are PAIRWISE collinear!
[rho,psi] are PAIRWISE collinear!
==== Identification analysis completed ====
You are not handling parameter dependence correctly, so the output may be misleading. Generally, the message indicates that the mentioned parameters cannot be separately identified.
Should I fix these parameters because the data is insufficient? Does it solve the issue?
Yes, if parameters are not identified, fixing them should help. But make sure that the problem does not come from a mistake in the implementation.
Thanks Prof, the problem has been solved and the identification analysis looks fine now. However, I got another problem. The mode check plots and posterior distributions look so weird. I spent the last few days delving deeper into the model but I can not fix it.
I would be very grateful if you can take a look at the mod file and give me some advice (if any).
Thank you and looking forward your response!
vina.m (2.0 KB)
working.mod (5.8 KB)
The constants in your observation equation are restricted to a narrow range around zero:
But i_obs has a mean above 7. That won’t work.
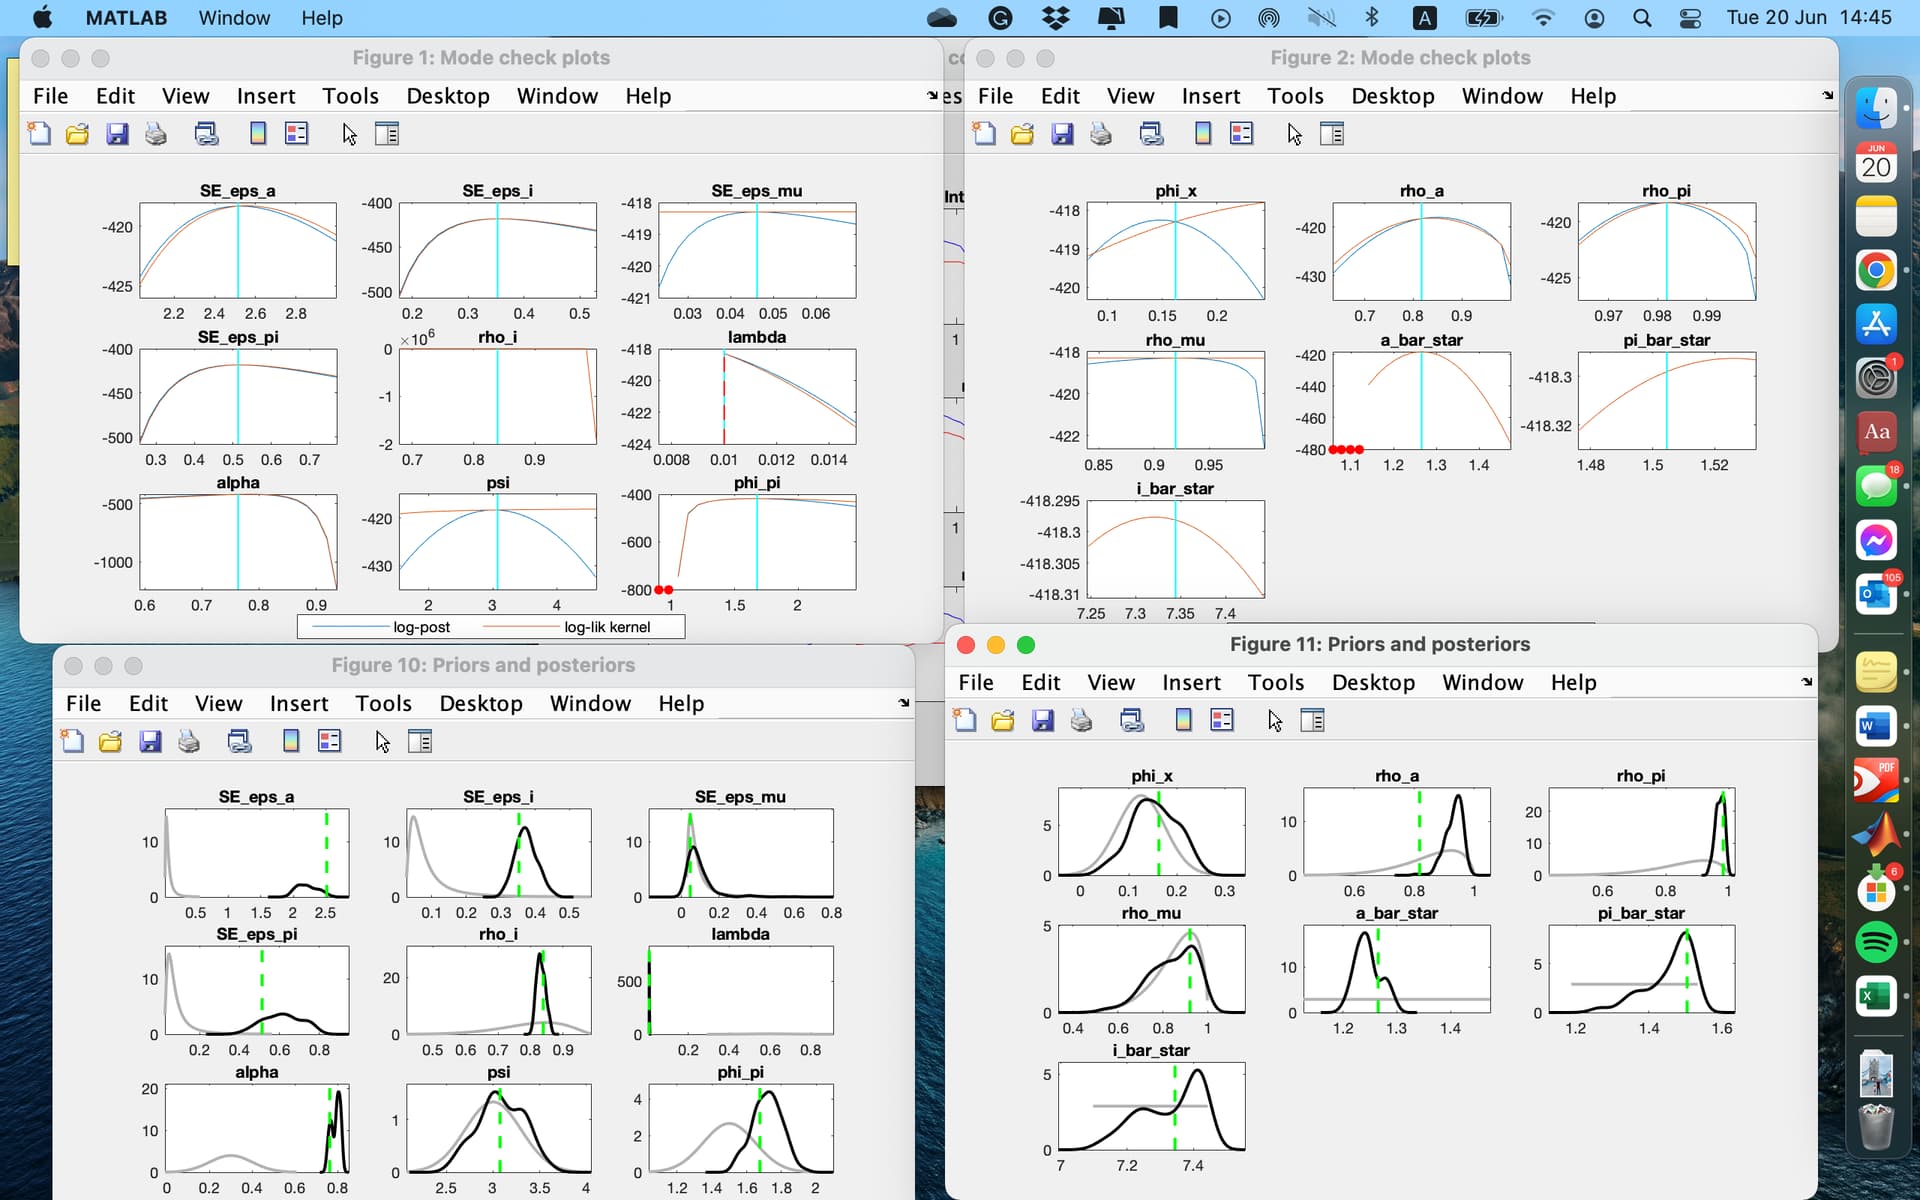
I adjusted the initial values of a_bar_star, pi_bar_star and i_bar_star to their empirical data means. Convergence plots and results look much better now, but there are a few of them that still are weird. Is there any room to improve them?
I attached mode check plots and posterior distribution for your information. Thank you!
There is still an issue with hitting the bound for lambda.
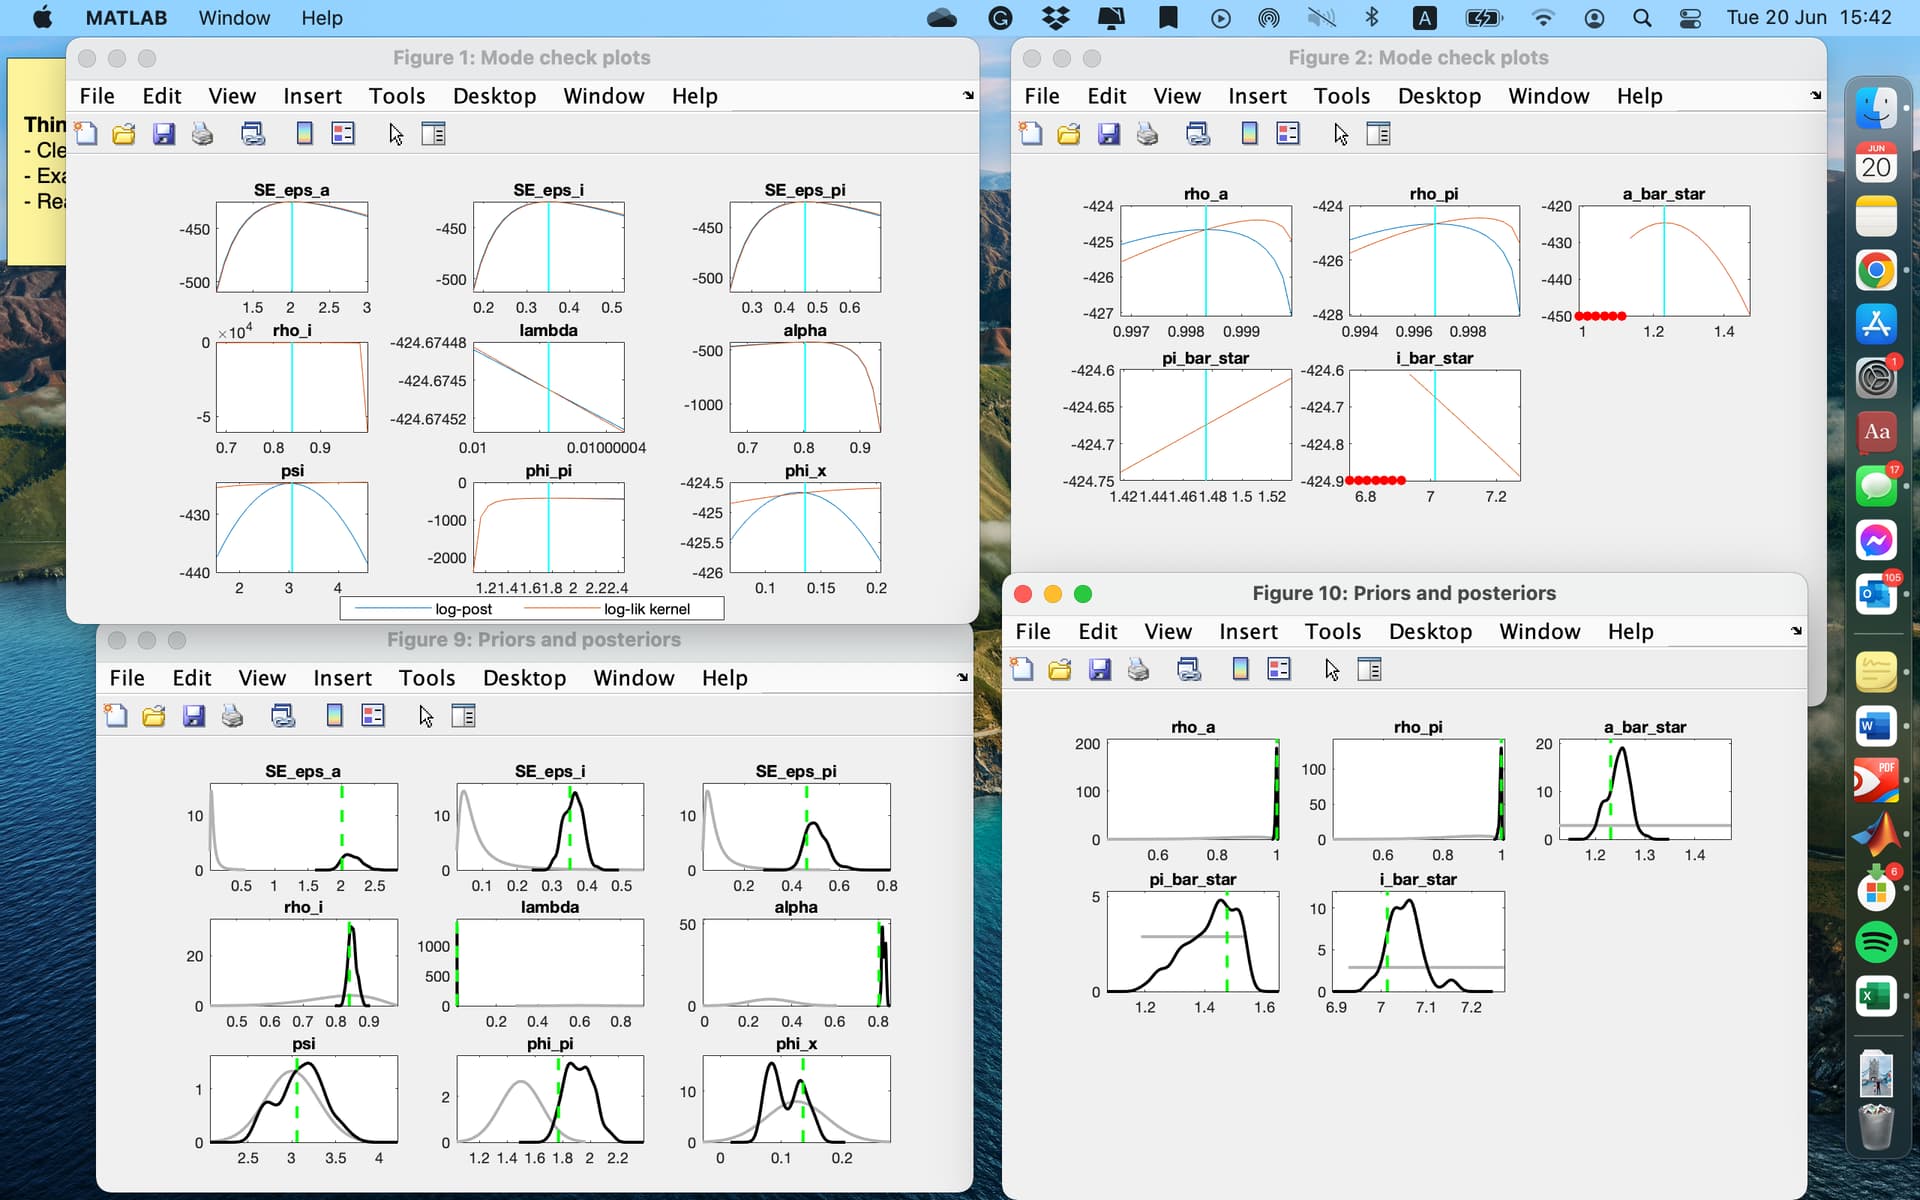
I have made a few adjustments, and no more hitting-bound issues now. But I have two questions from the results:
- Some parameters (i.e., lambda, pi_bar_star, i_bar_star) have mode check plots with straight lines instead of curves. Is that okie?
- Most posterior distributions have their peaks different from the mean. Is that a sign of failed estimation?
Thank you!
But your mode finding still did not return a proper mode.
I see. Do you have any suggestions on how I can improve the mode check plots?
Try a different mode-finder, e.g. number 5.
I have tried mode 5, the lambda parameter still is at the prior bound, but lambda is the ratio of rule-of-thumb consumers, so it can not be outside [0.1]. Then I fixed lambda = 0, everything is going well. However, lambda is my main focus, so I don’t know how to fix it. Again, I would be grateful if you have any further recommendations. Thank you Prof!
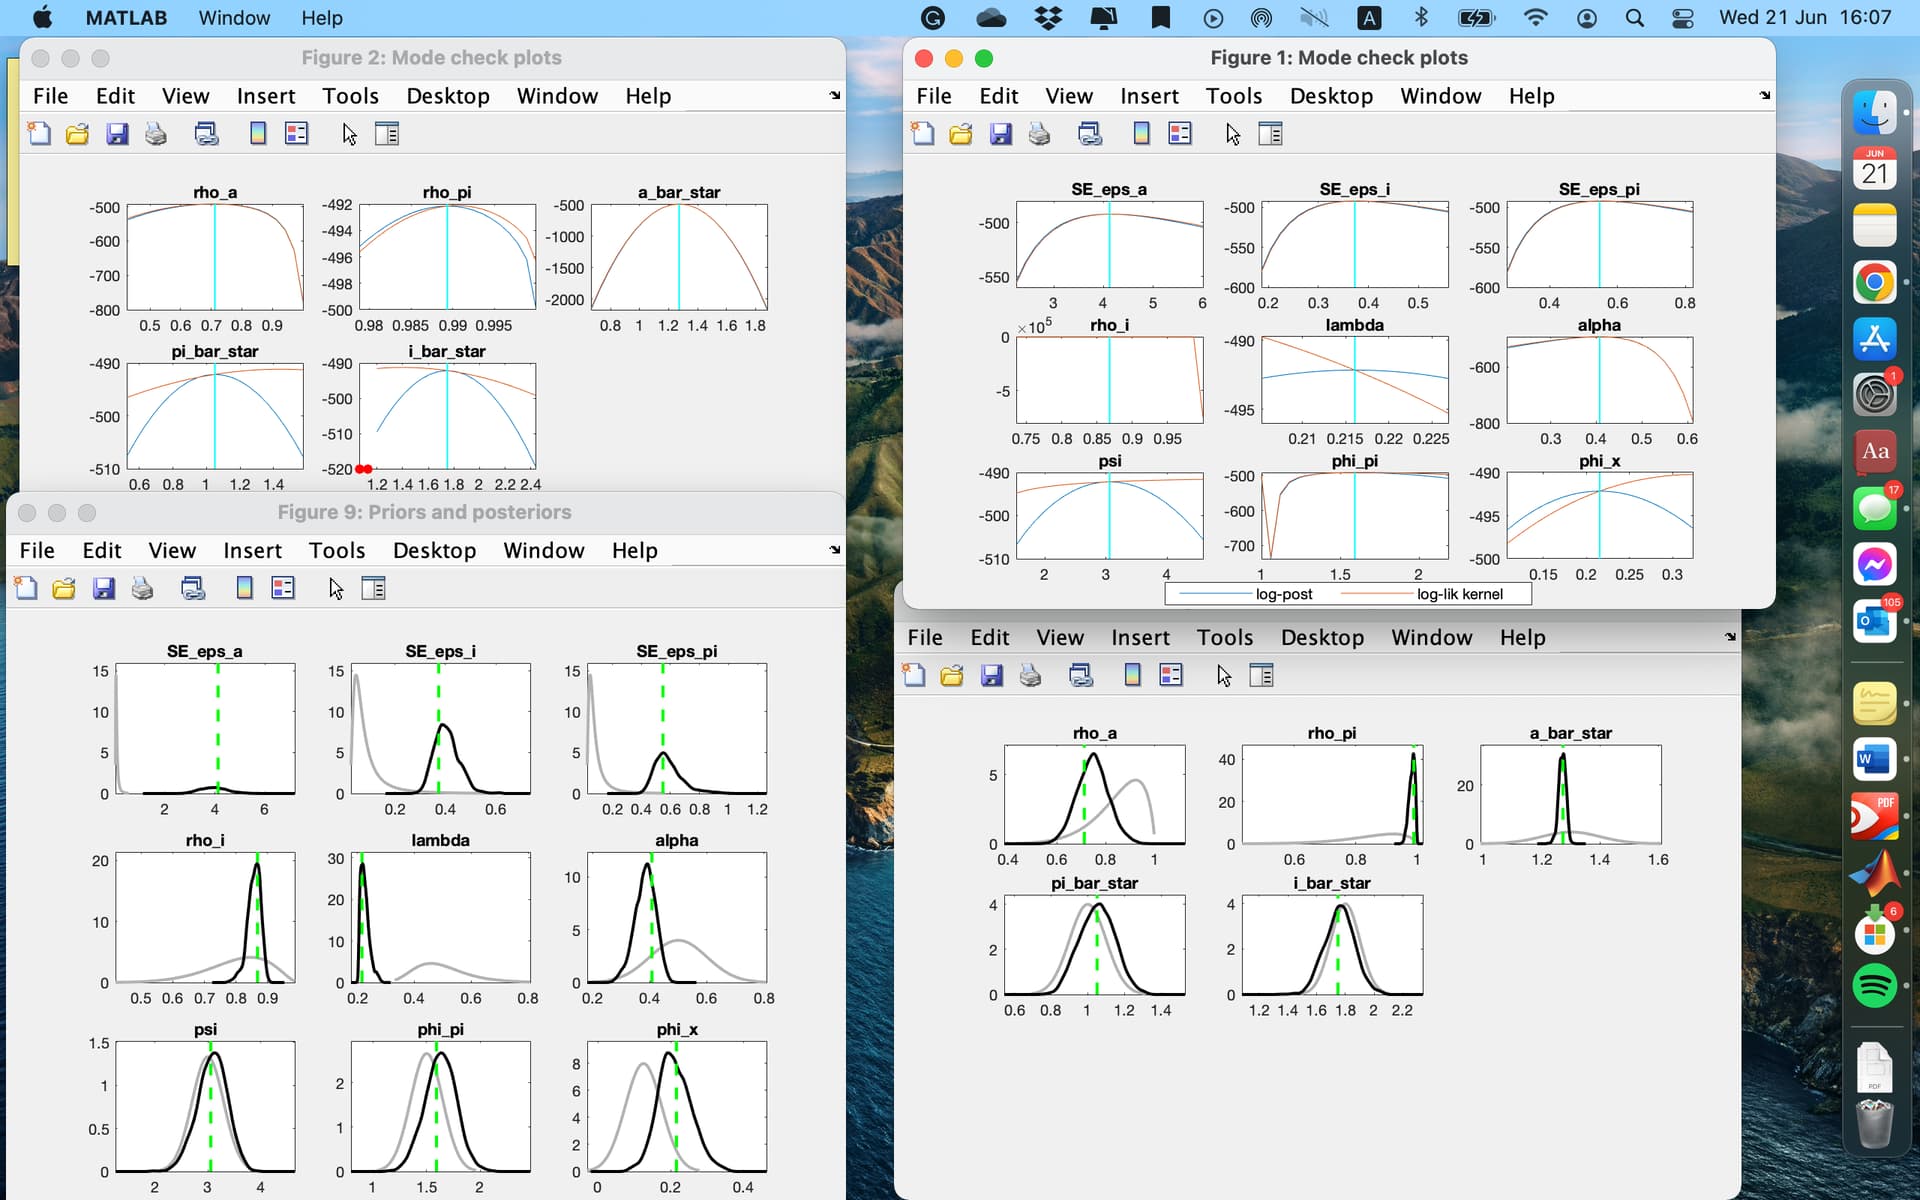
Thanks Prof for the useful suggestion. I changed the prior_shape for lambda and got a better result. Convergence diagnosis and identification are fine. But the mode check plot for phi_pi is quite weird. Is that okie?
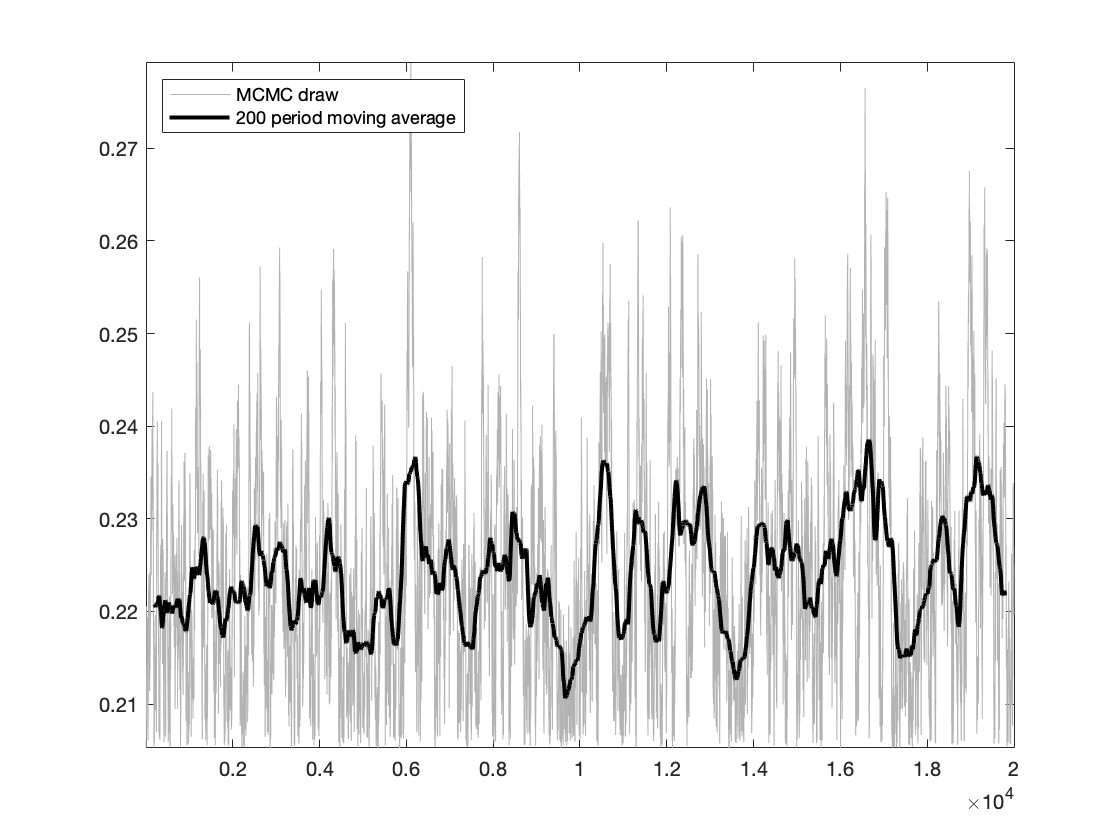
I appreciate your help, Prof. I have one more question, I just added the trace_plot option to the estimation command and realize that the trace plot is not smooth even though it has no obvious trend (the graph is attached). I am using 20,000 draws, should I increase the number of draws to smooth out the graph?
Thank you!
Trace plots are usually not smooth because the MCMC returns correlated draws. But yours actually looks pretty good.
Dear TuyenTran_NUIG,
Is it possible you share what you have changed in your .mod file so that I can maybe see where I can improve mine? I also have the same issues.
I’d be very grateful.
Thanks again,
Taher