Hi everyone,
I have a question regarding the effect of the financial crisis on the correlations of the variables. During the financial crisis, some variables were changing significantly; however, the others were not changing that much. As a results, the correlations between some of the series change for the period only because of the huge change we obsered during the crisis. It means these series have positive correlations before and after the financial crisis but adding only a few observations of the year 2008 or 2009 change them to negative or zero. If you do not have lots of data to split your period into two periods, what would be the best strategy to deal with this problem and remove the effect of the financial crisis?
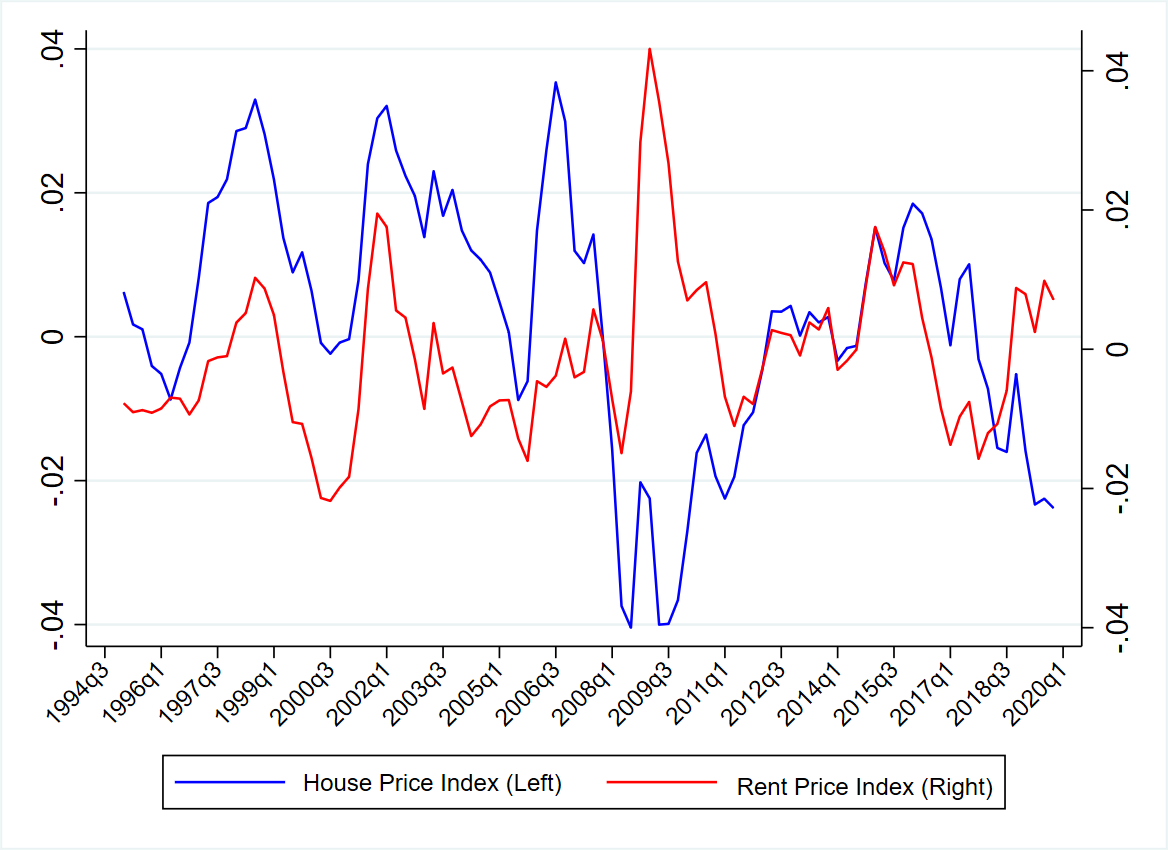
As you can see in the attached image, the cycles of rent price and house price co-move from 1995 2008 and 2009 to 2018 and if we remove the year 2009, the correlation becomes positive (from negative) for the entire period. How could you deal with this problem if both the theory and results of the model confirm that the house price and rent price move together.
P.S. These series were in real terms and the logarithm forms before imposing one sided HP filter to get the cycles of each one.
This is tough problem. You can only approach this with theory. What do you think explains the movements in 2009? Often, it’s a particular shock, which you may want to include in the model.
Thanks for your reply.
It’s true. It happend because of the financial crisis and the rent price was sticky and did not drop as much as housing prices.
My problem is that if I want to consider the entire period and want to match the results of my model with the actual data, I should get a negative or close to zero correlation between the rent price and house price (only because of the year 2009 and its huge negative effect that causes the correlation to become negative or close to zero) but the model can generate the positive correlation close to the actual data (if I do not include 2009). If I split the data, I loose many observations. When it comes to VAR or a reduced form, I can consider the financial crisis effect by adding a dummy variable but I do not know how to deal with that in a DSGE model.
Are you estimating the model? Or just matching data moments?
Thank you so much for your time. I don’t know if I get it correctly but I tried both Bayesian and simple DSGE models. From both, I get positive correlations for the house price and rent price. Then I tried to compare the correlations and second moments of the variables of the model with actual data to see if both models can replicate the actual data. I have several shocks in the model but I don’t know how to add a specific shock for that period or add that in the model. I can attach my codes if it helps.
I’ve seen some researchers check the pattern of IRFs of the model with VAR and if they get similar pattern as in VAR, they claim their models work properly. Do you think this approach makes any sense these days? If yes, I might be able to take out the effect of the financial crisis by adding a dummy variable to a VAR model and see if the patterns of IRFs from the model and VAR match.
If you are doing Bayesian estimation, you could simply set the financial crisis observations to NaN and see whether that makes a big difference for your model. The VAR model would only help if you could cleanly identify the shock you are interested in. Having a dummy is essentially throwing those periods out.
Thanks again for your rely.
My problem is more with the actual data. When I want to check the properties of the model, the correlations and standard deviations of the model match properly with actual data if I remove the year 2009. Do you think that it is OK if I drop this year (2009) in the actual data, then calculate the correlations and s.d s and then compare the model with those numbers?
Regarding the VAR model, what do you mean by saying “indentifying the shock cleanly”? Do you mean that if I only want to concentrate on the monetary policy shock (not other shocks), it is acceptable to compare the results from VAR with the model?
Again, thanks for your time
Thank you so much. I really appreciate your help.
You mentioned that I can include a specific shock to consider the effect of that year solely. Could you please explain that more? Do you mean defining a period and a value for the shock?
No, I meant that you are currently considering unconditional correlations. But what matters are conditional correlations after particular shocks. The unconditional correlation is an average of the conditional ones. If in “normal times” a correlation is positive, then a shock that induces a positive correlation dominates. When adding 2009 alters that correlation, that usually indicates that a different kind of shock with a negative correlation happened. My question was whether you have such a shock in your model that can give rise to such a correlation. That shock may not matter at all in other parts of the sample.
Thank you so much for your answer. It really helps me.