Hello everyone,
I am a bit confused about simulated series after bayesian estimation.
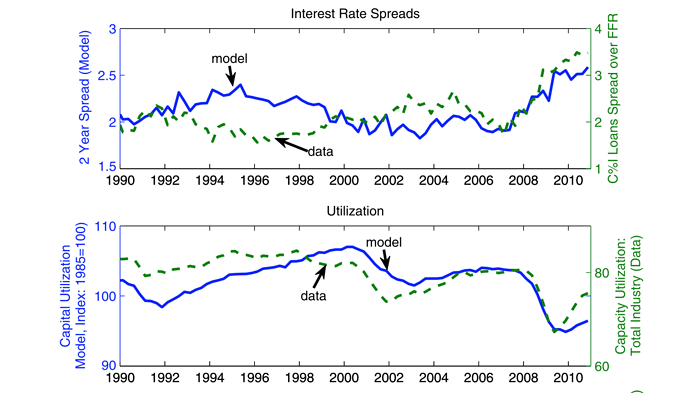
More precisely, I attached an estimation from M.Iacoviello (2015), ‘financial business cycles’ which compares the data to the estimated model.
How can I compute this type of results with dynare ? (i have already estimate my model with bayesian technics)
Best,
As the figure note in the paper tells you, the blue line is from the Kalman smoother, which you can enable via the smoother option. The green line is a data series not used for estimation, plotted in the same graph.
1 Like
Hi,
I thought about the r_plot command after bayesian estimation.
Thanks a lot for your help,
Best,
No. If you want to combine plots not related to Dynare output, you have to do this manually using Matlab’s plotting capabilities
