Hi everyone, hi Dr. Pfeifer,
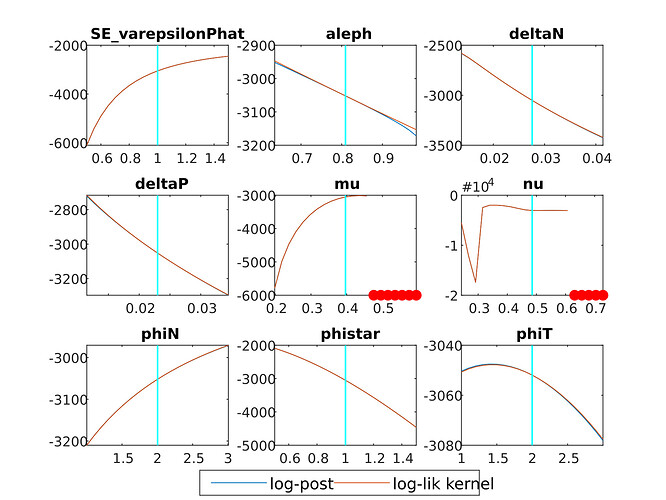
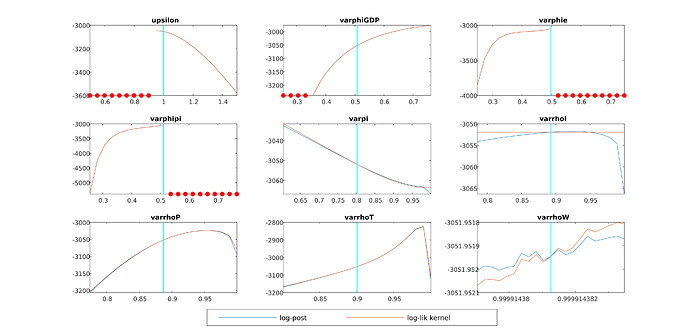
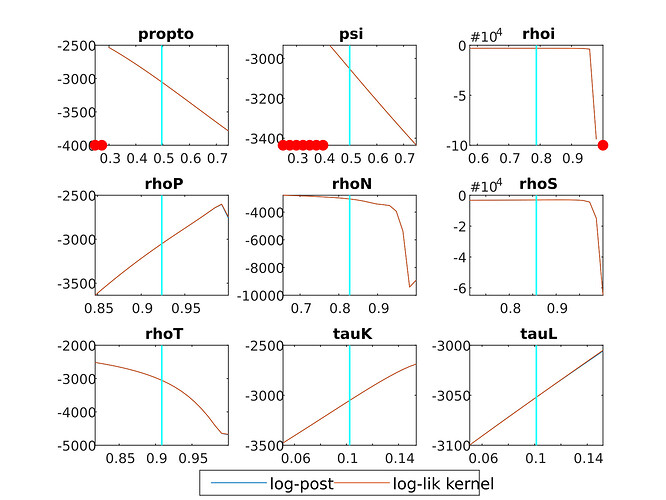
I have observed in this forum that the command mode_check serves to identify problems with the parameters of the model, in particular, if the log-likelihood function is flat, we can say that there is an identification problem (correct me if not).
I use the command to see what happened to the parameters of my model, apparently they all behave well, (except varrhoI) however, there are some that are flat and suddenly have peaks (rhoi) or there are some that seem to have volatility (varrhoW), and I would like to know if this is telling me something or just that my parameters are not entirely flat.
I attach the graphs


