I’m estimating a model with Dynare and when I use mode_check plot, I see that the graphs look very bad. Here are the problems I’m facing :
The log density is Nan (the Hessian matrix isn’t definite positive). Thus, I can only use mode_compute = 6 but I know that this often means there are underlying problems in the model or in the data.
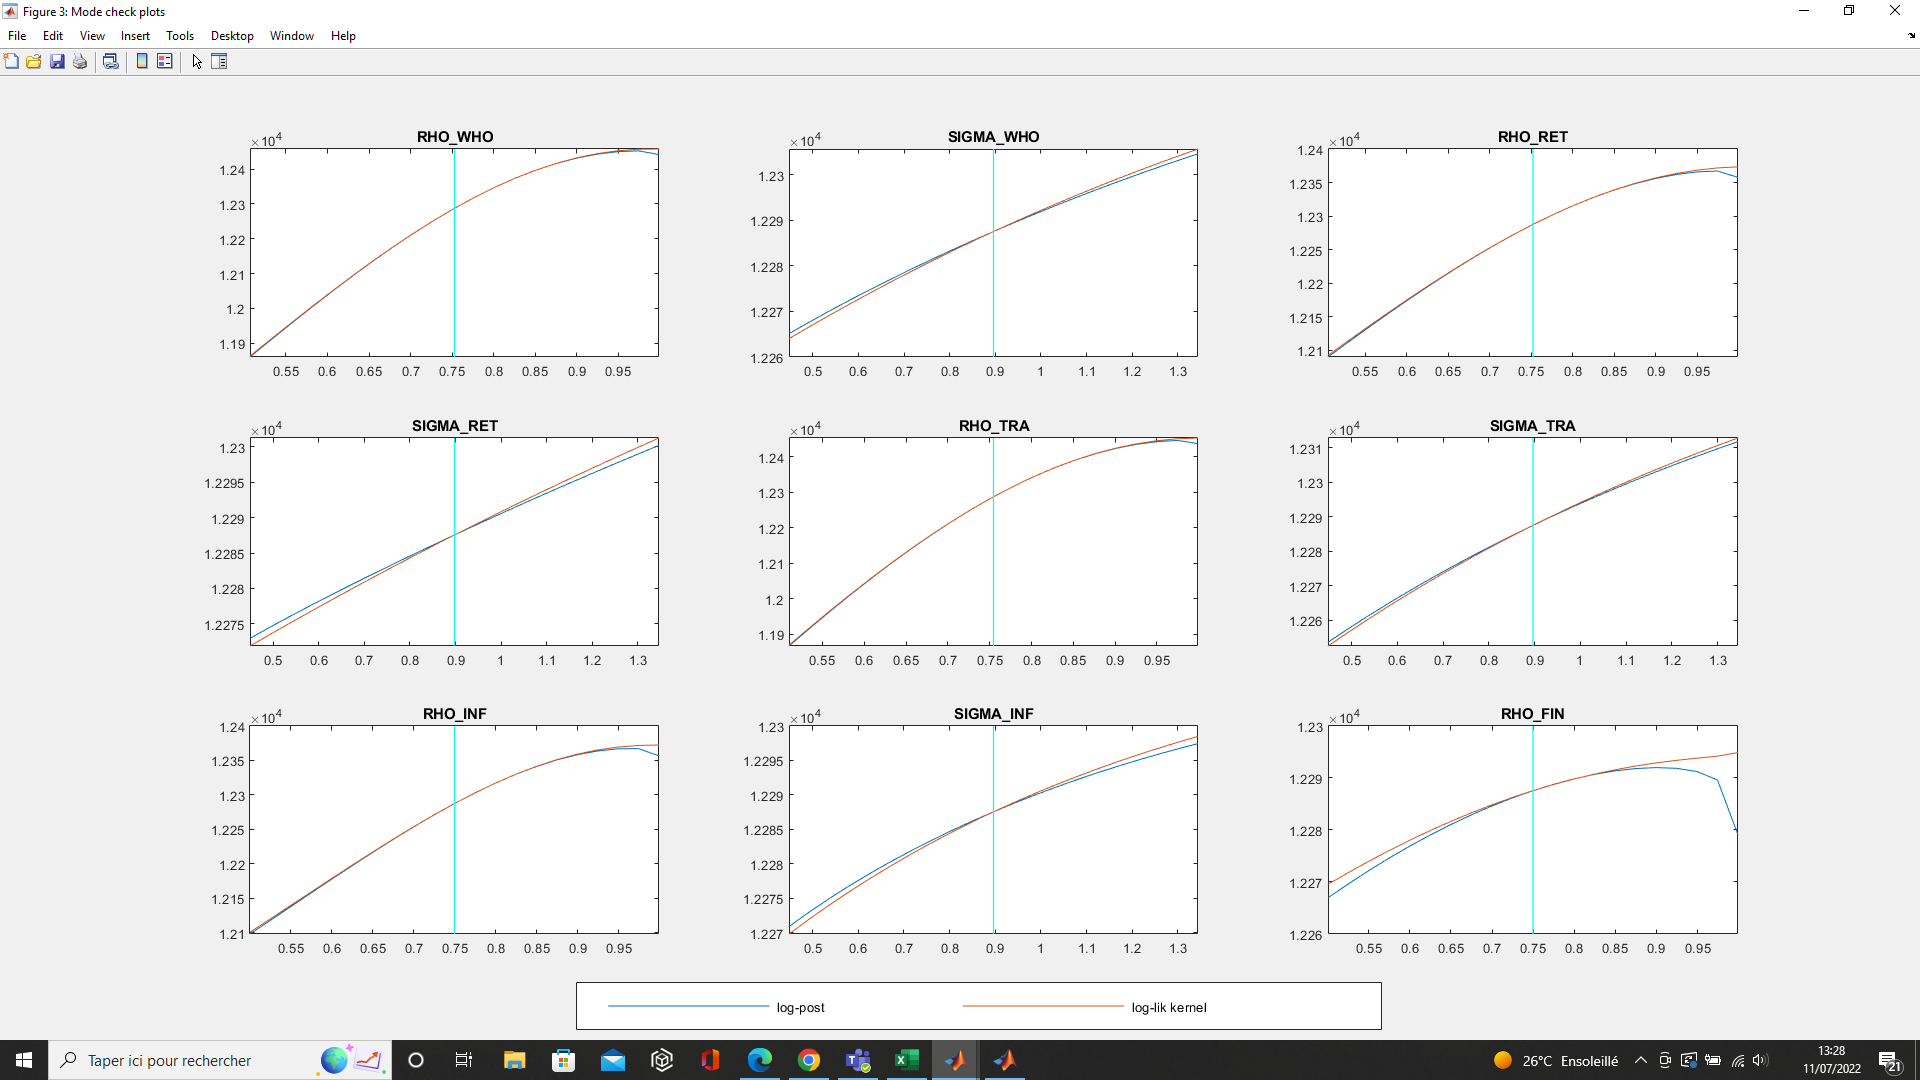
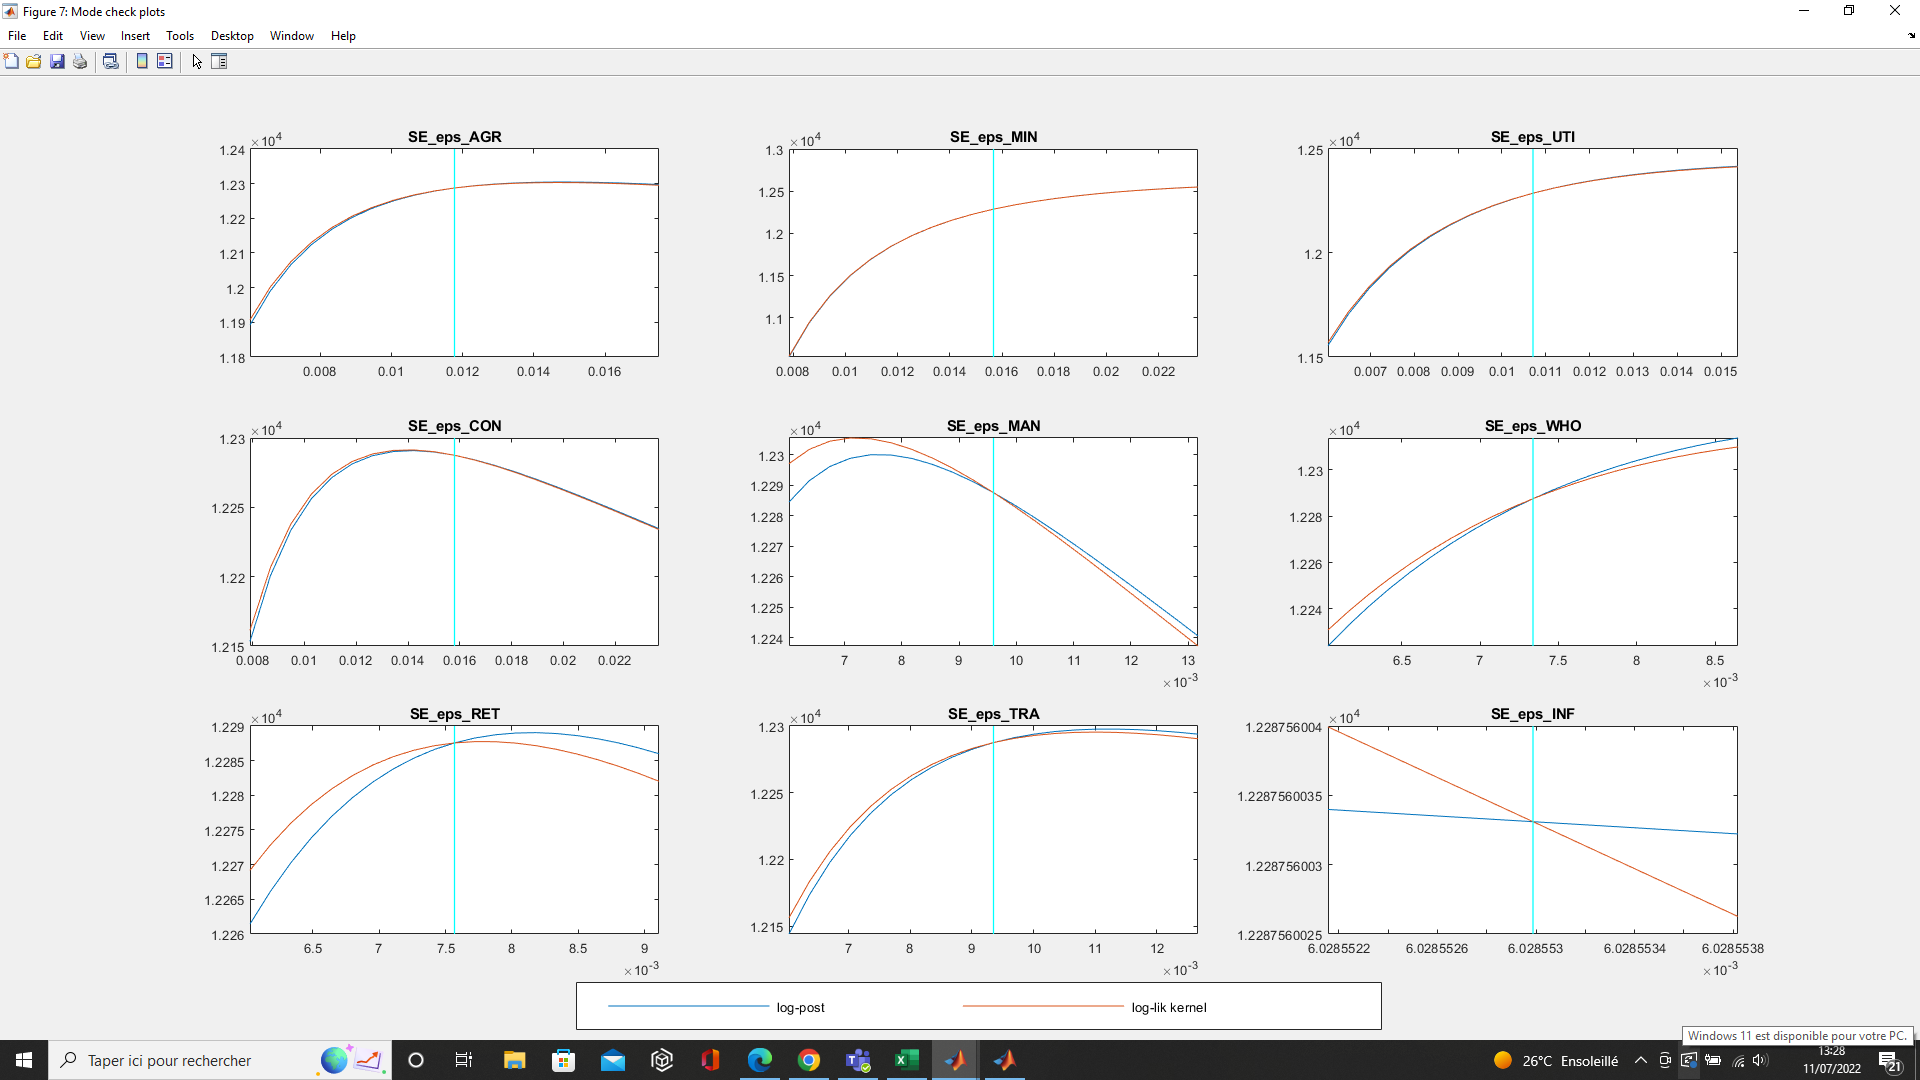
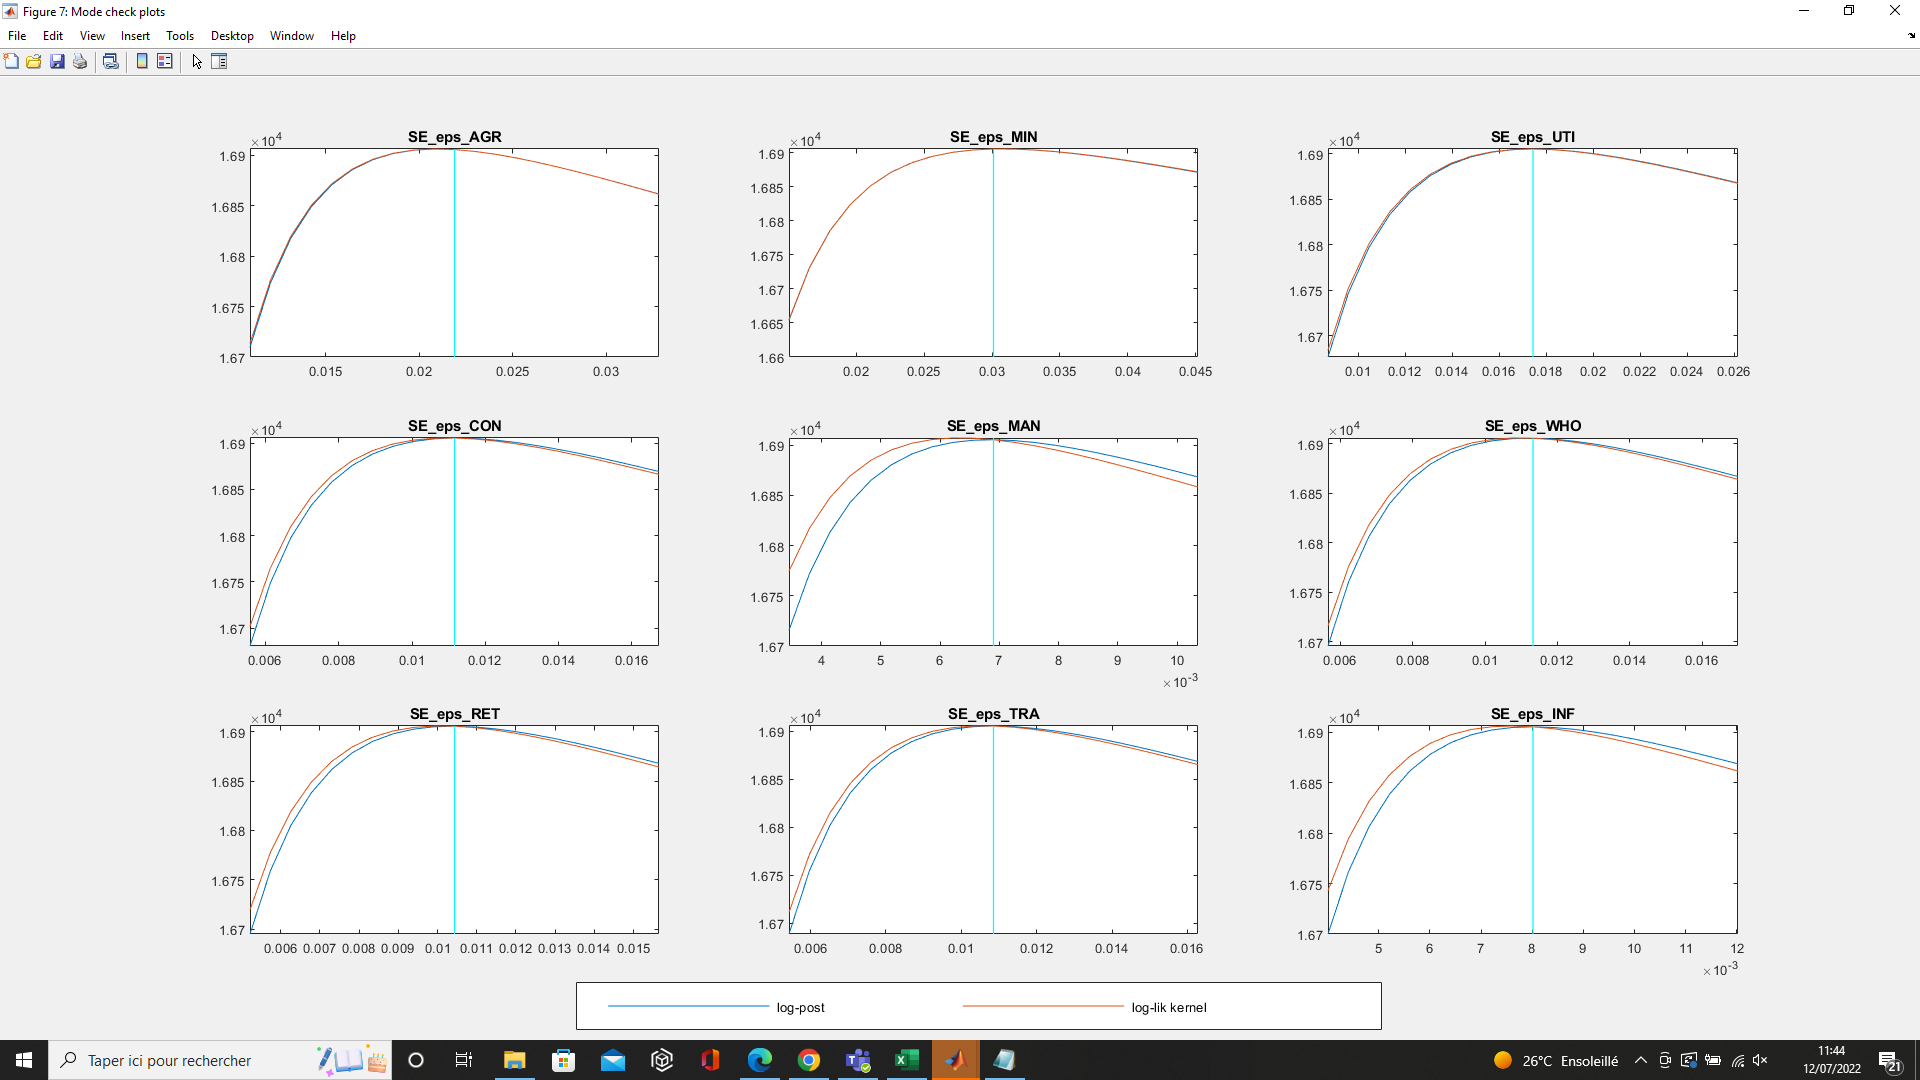
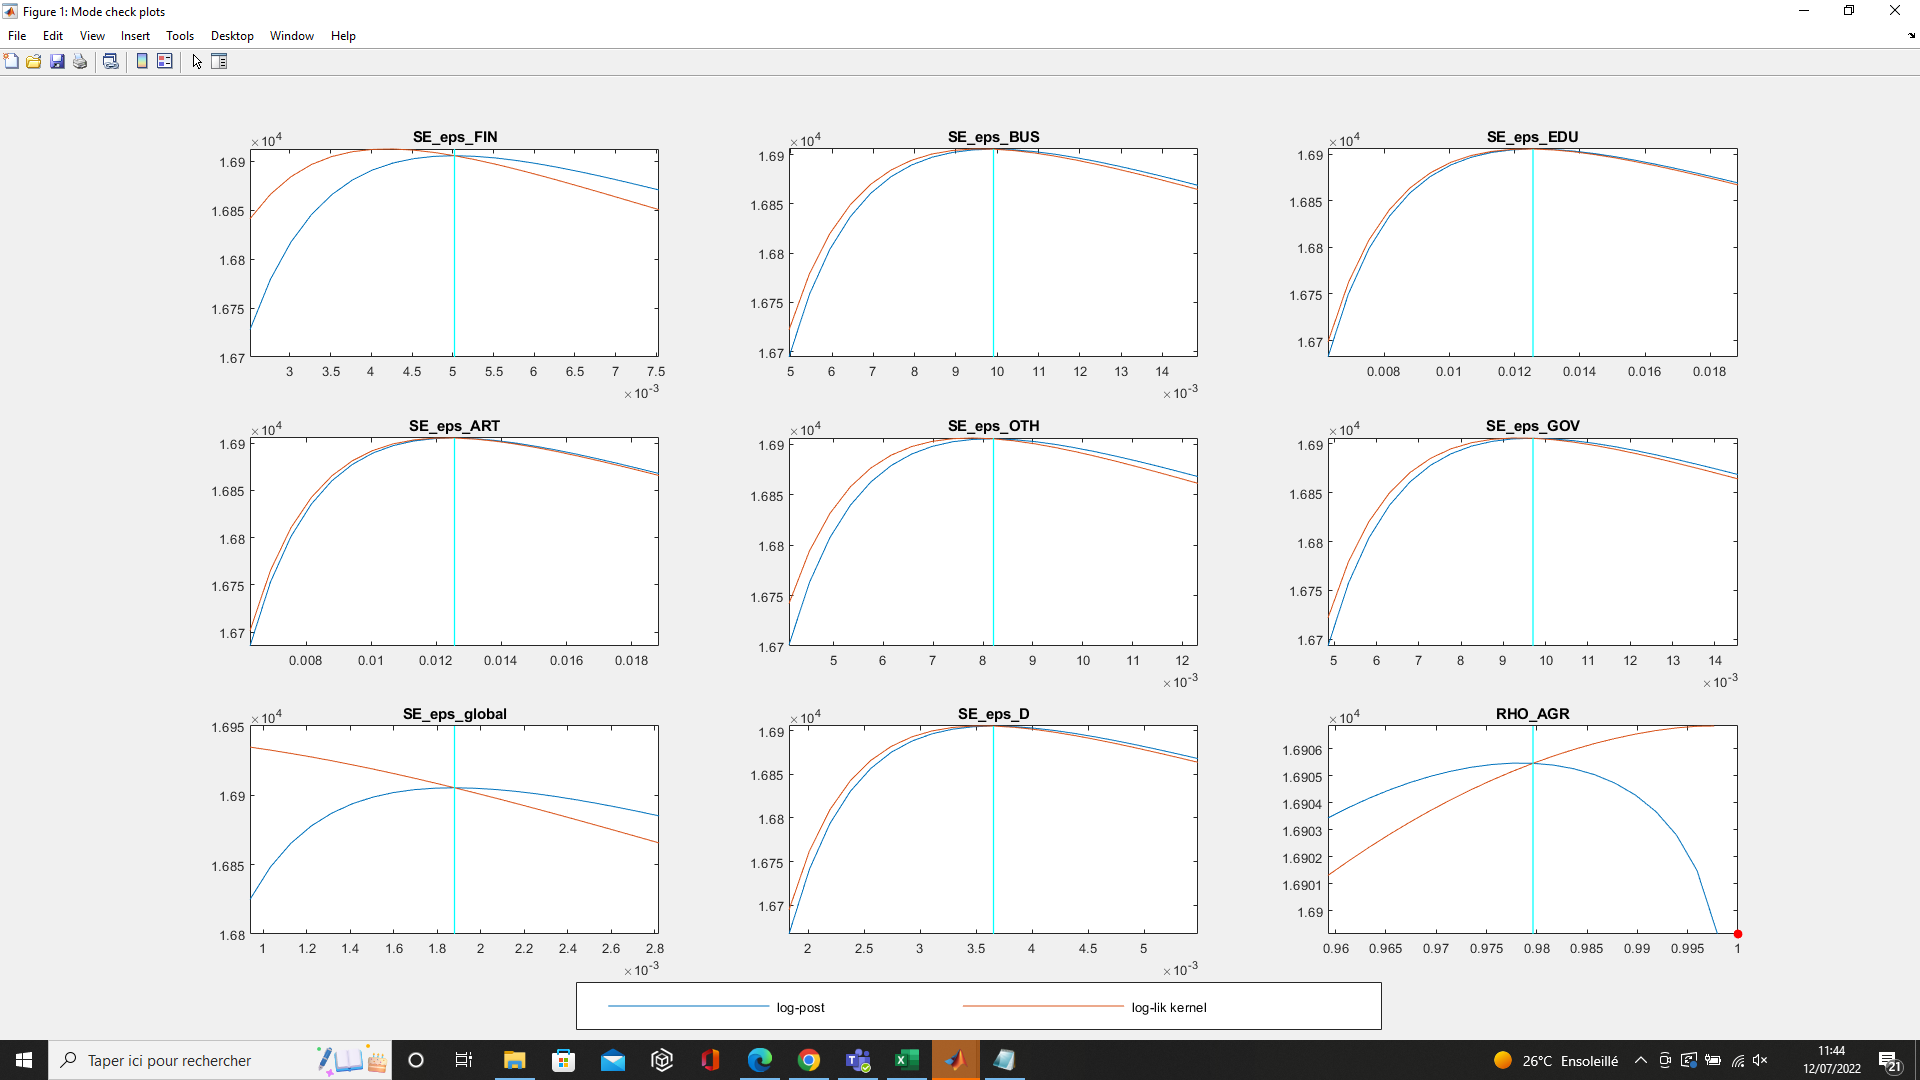
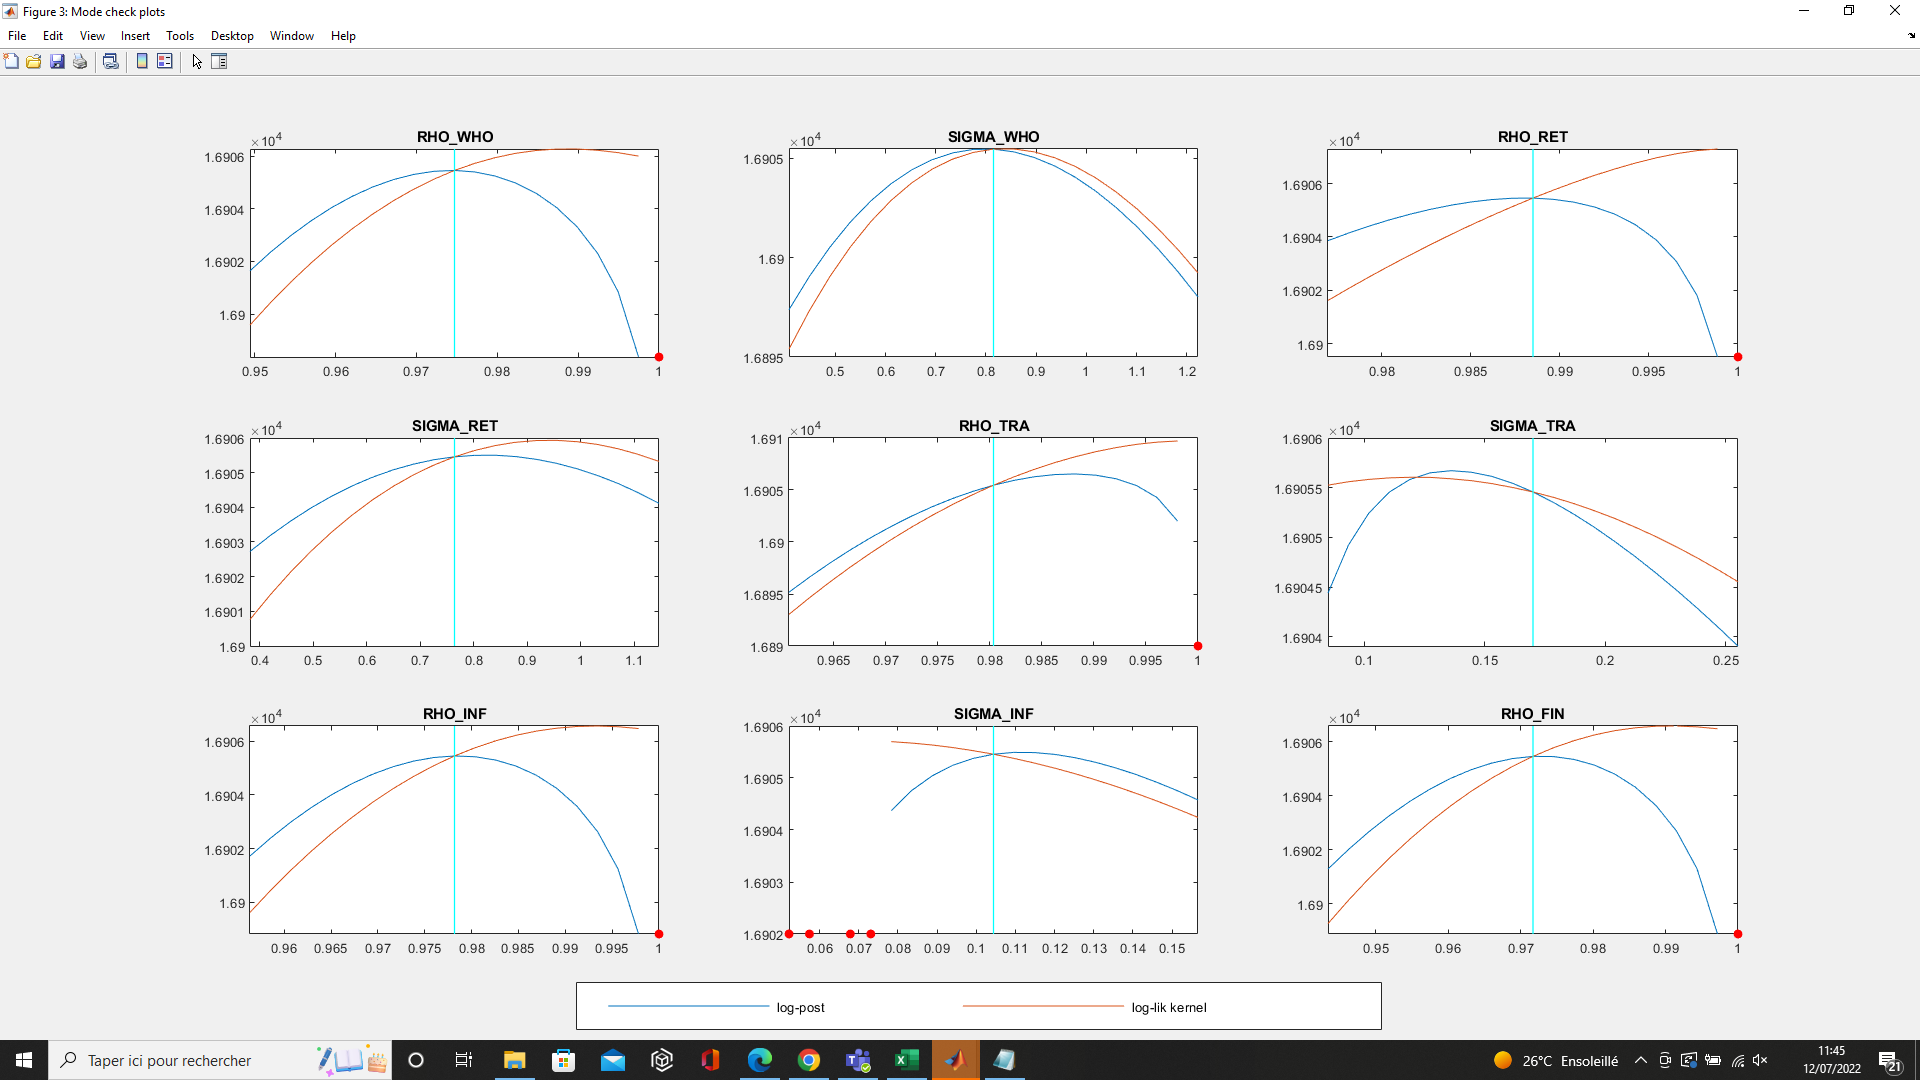
The plots are very bad, if I’m right, because they don’t coincide on the maximum of the curves. Note that the vertical line is often at the prior mode (0.75 for RHOs and 0.9 for SIGMAs). I don’t understand what it means.
To my understanding, the error comes from my model. However, I managed to get some correct results in the past. What is the most common problem when the mode_check plots are this bad ? Is it necessary that the vertical line hits the maximum ? What is the main issue with hessian matrix not positive definite ?
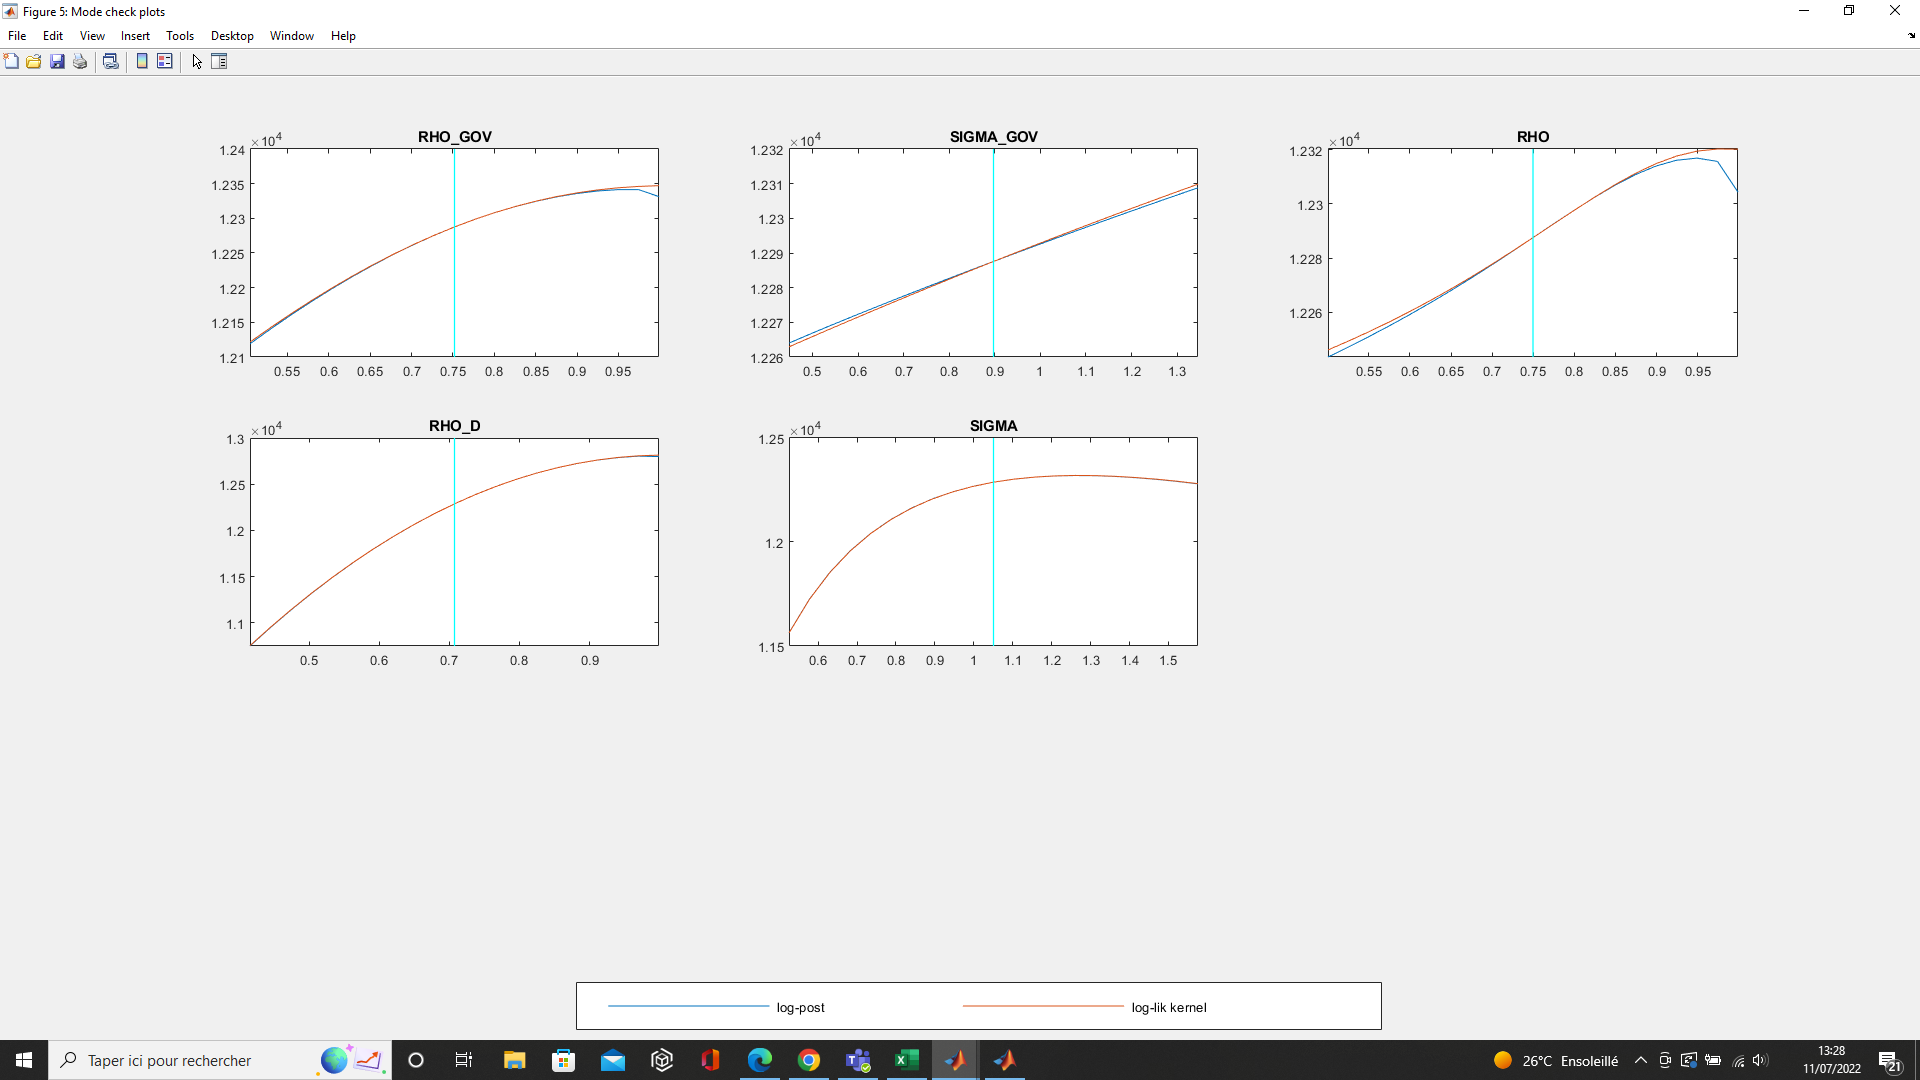
I used prior_trunc = 0 and now it looks like this. The standard errors look much better (except for se_eps_global) but the other paramers look bad. I got error code : 3 and error code : 19 for some values, but my problem is still that my Hessian isn’t positive definite at the mode… Is it always a problem in the model ? Thank you very much
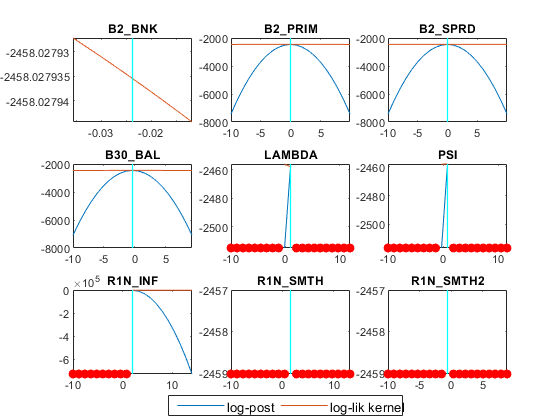
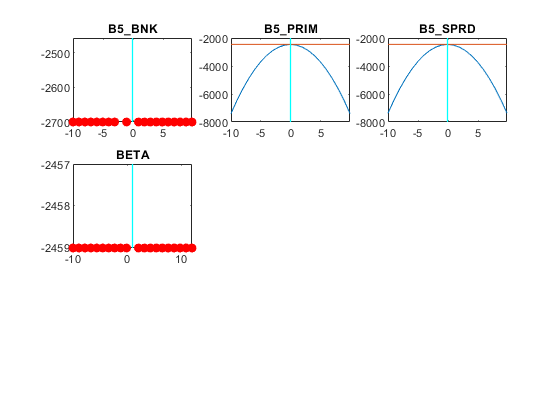
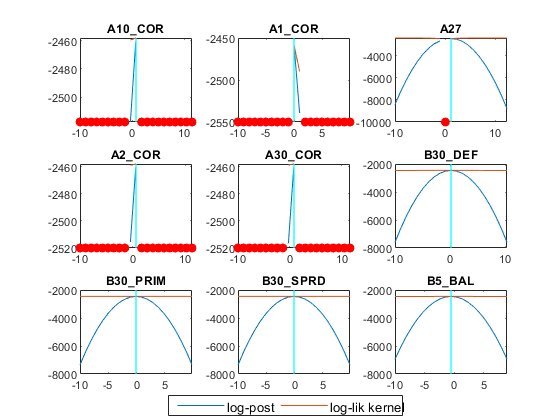
Hello, I want to continue this discussion about model_check plots and bayesian estimation. I have a semi structural macro financial model. I have some questions regarding the mode_check plots I attached and I did not find convincing answer in the forum
1)the model works fine with in a stochastic simulation context
2) all the parameters succeeded the identification test
3) when estimating one by one the hessian is positive definite but not anymore when I estimate all the parameters. My questions are the following:
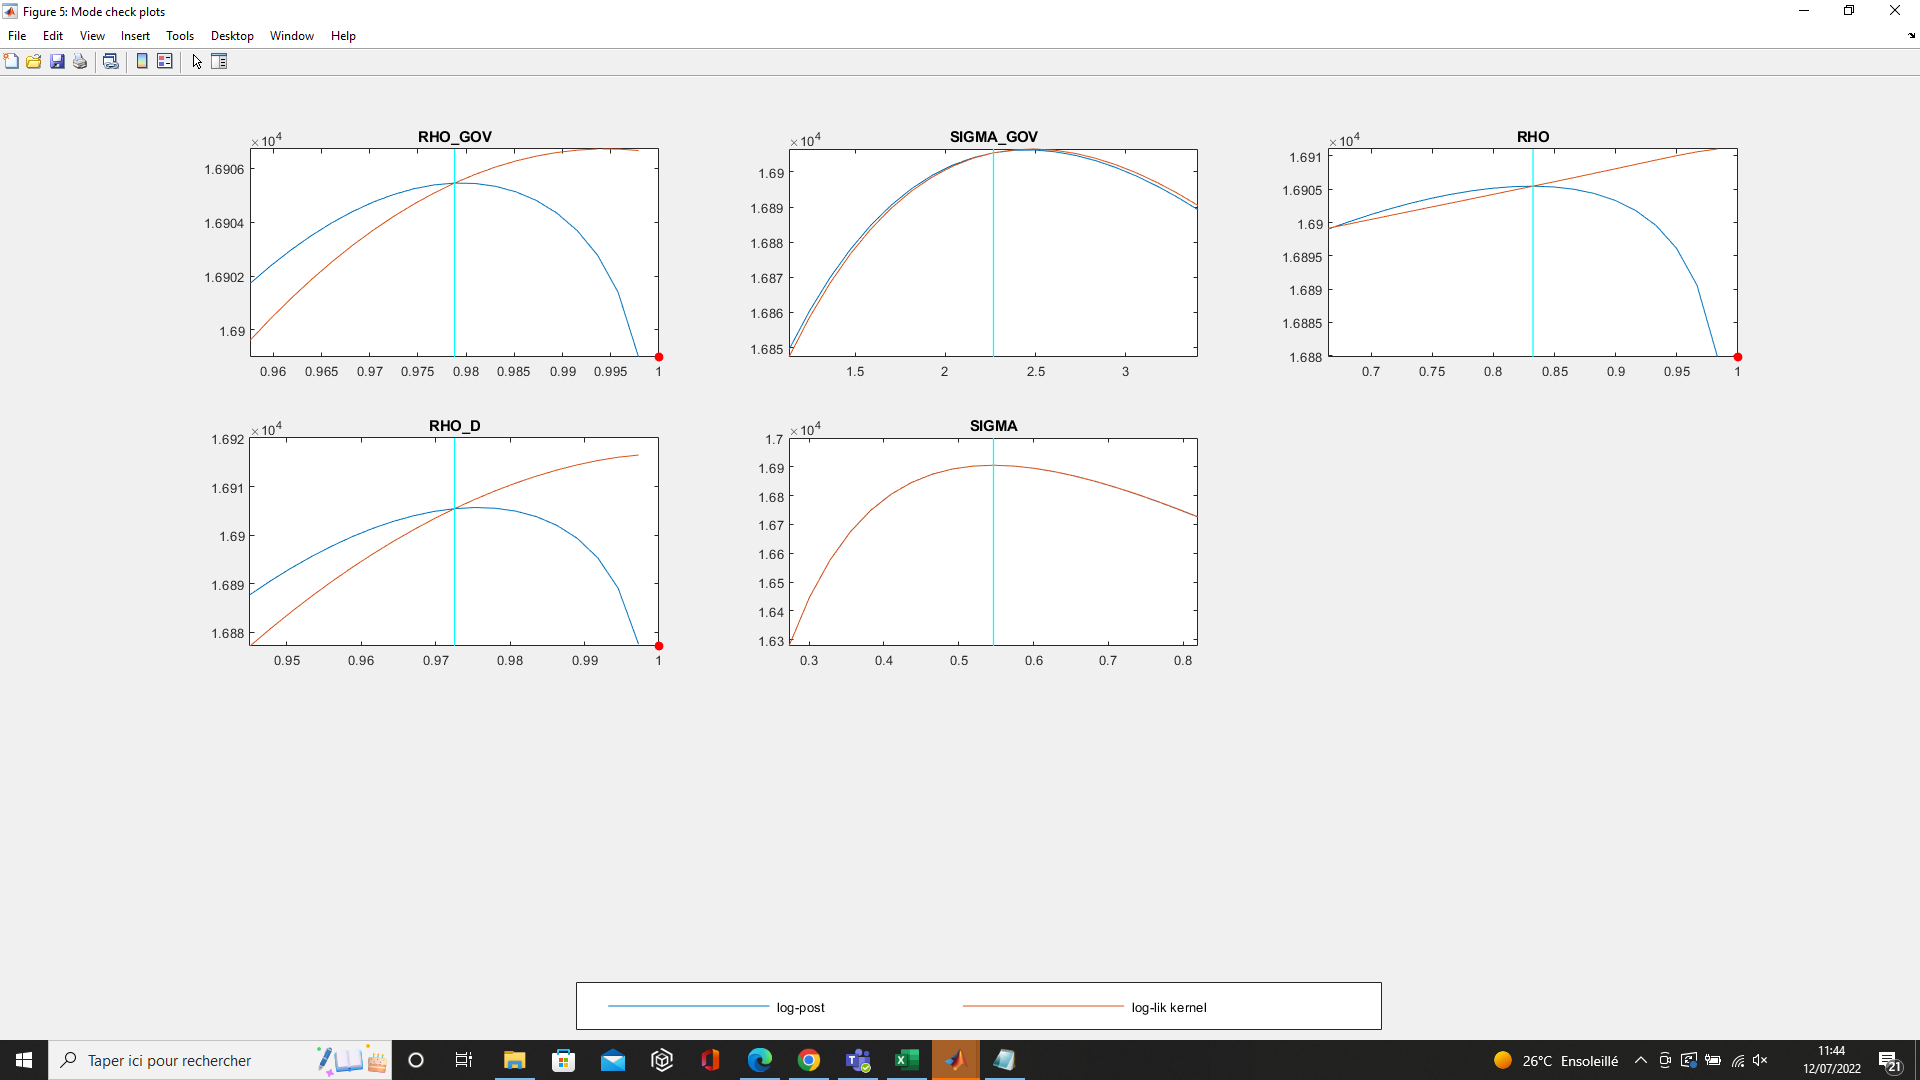
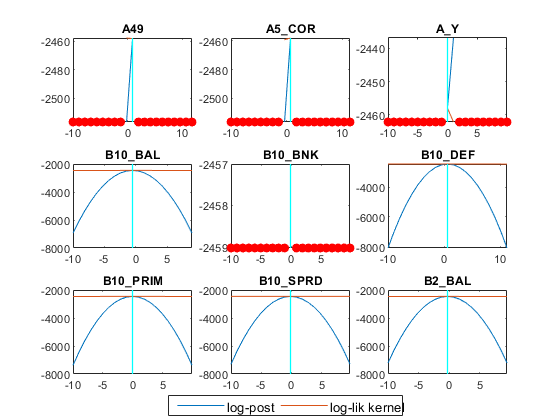
a) for parameters that behave like A49, does it mean that I should play with priors means and/or decrease the standard deviation ?
b) for parameters that behave like B2_SPRD, I read in the forum that this is a behaviour of not identified parameters. However they seem to be identified. Therefore I was wondering if it is related to data
c) (maybe another topic) even if I estimate one of the parameter with a positive hessian matrix, occbin solver stops after a certain number of periods
What is the cause of the red dots? And which type of estimation are you conducting. Also, the identification results may not be valid for an Occbin estimation.
1 From what I read in your paper and in the forum, the red dots are the values of a parameter for which the BK might not be satisfied
2 I am conducting a bayesian estimation.
3 To perform the identification test, I had to remove the “occbin_constraints” block