Mode check plots and steady state

Dear Professor,
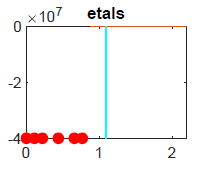
Some mode check plots generated by my model look different. See etals for example.

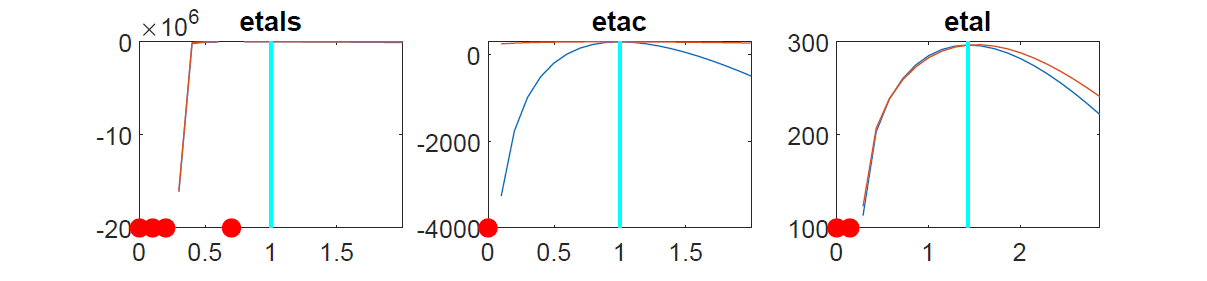
Also, I see mode check plots of some other variables with a horizontal posterior likelihood function. So, prior and posterior are the same.

In addition, my results are wrong because I get negative values for Yu (the informl_economy_size), which cannot be negative.

I’m trying to understand if there’s an error in my steady-state file that I haven’t found yet. Could you please guide me in finding out any possible errors?
Thank you!

model_estimation_CheckPlots1.pdf (7.8 KB)
model_estimation_CheckPlots2.pdf (8.4 KB)
model_estimation_CheckPlots3.pdf (6.5 KB)
data_model1.mat (2.9 KB)
model_estimation.mod (8.3 KB)
model_estimation_steadystate.m (2.5 KB)
obs_ss.m (725 Bytes)
parameters.mat (1.5 KB)

  1. There seems to be a problem with identification. That may be caused by your steady state file. Please adjust it following the example at examples/NK_baseline_steadystate.m · master · Dynare / dynare · GitLab
  2. If a parameter cannot be negative, the prior should not allow it to be negative.

Thanks a lot for the reply!
Professor, I am still struggling to get the work done.
I have defined the measurement errors in the mod file as follows;
stderr Ym_obs,0.01, inv_gamma_pdf, 0.01, 0.001;
stderr Hm_obs,0.01, inv_gamma_pdf, 0.01, 0.001;

  1. Could you please kindly tell me whether the way I have defined the measurement error is correct?
  2. What are the possible causes of a mode check plot looking like this?
    image

Thank you.

  1. That does look ok.
  2. The reason for the graph is the error code (the red dots). They result in a penalty that screws up the scaling.

Thank you!