Hi professor,
I am writing to ask if it is possible to adjust the position of titles for all the subplots.
Below are my codes:
load IRF.csv;
load IRF1.csv;
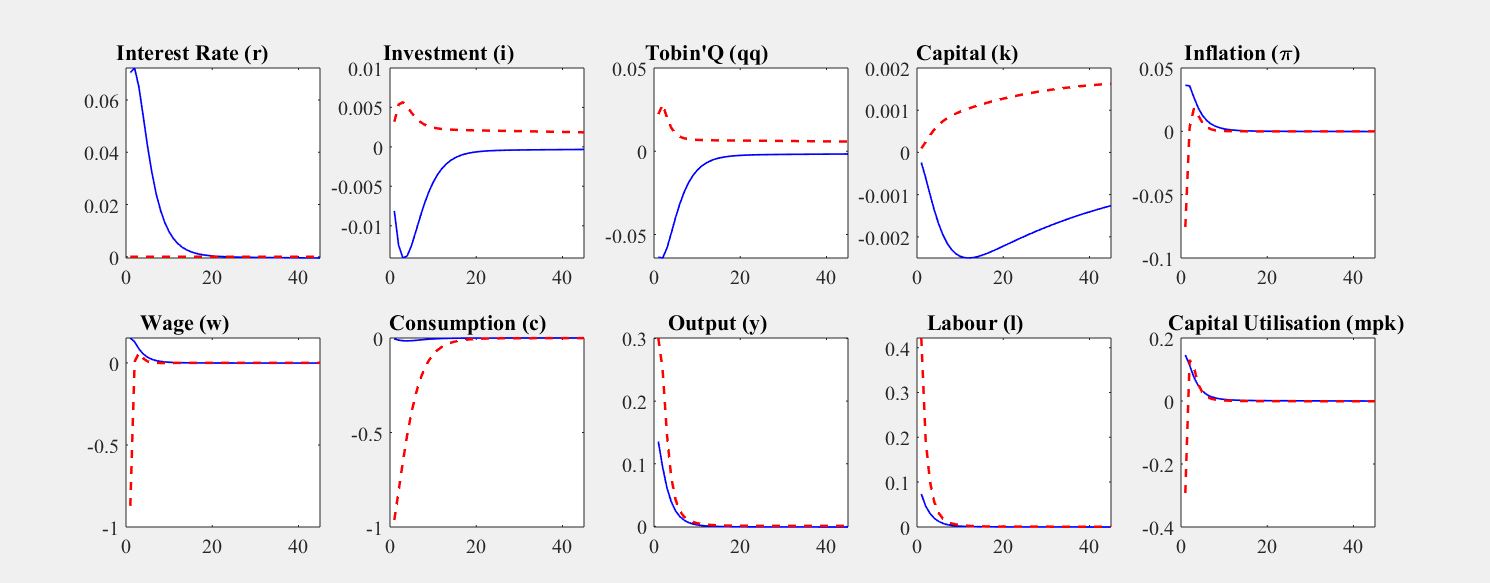
varname=strvcat('Interest Rate (r)','Investment (i)','Tobin''Q (qq) ',...
'Capital (k)','Inflation (\pi)',' Wage (w)',' Consumption (c)',...
' Output (y)',' Labour (l)',' Capital Utilisation (mpk)',...
' Premium (pm)',' Real cost of Credit (rk)',...
' Networth (n)',' M0',' M2');
figure('Units','inches','Position',[1 0.5 13.5 7.5],...
'PaperPositionMode','auto');
for i=1:15
subplot(3,5,i)
plot(IRF(:,i),'b','LineWidth',1);
title(varname(i,:));
hold on;
plot(IRF1(:,i),'r--','LineWidth',1.5);
set(gca,'Units','normalized',...
'FontUnits','points',...
'FontWeight','normal',...
'FontSize',12,...
'FontName','Times',...
'defaultTextInterpreter','latex')
ax = gca;
ax.YAxis.Exponent=0;
Lgnd = legend('Normal','Crisis');
set(Lgnd,'FontSize',12,'FontWeight','Bold');
Lgnd.Position(1) = 0.015;
Lgnd.Position(2) = 0.2;
print -depsc2 myplot.eps
end