Hi Professor,
I am wondering if it’s possible to display IRFs reading like " 0.002" rather than 2*(10^(-3))?
Please see attached the pic.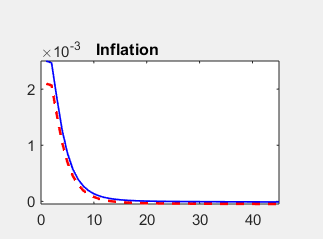
Best
Hi Professor,
I am wondering if it’s possible to display IRFs reading like " 0.002" rather than 2*(10^(-3))?
Please see attached the pic.
Best
You would need to do this manually. See e.g. https://stackoverflow.com/questions/10454047/removing-scientific-notation-in-the-tick-label-of-a-matlab-plot
Thanks for your reply.
But I have found the better solution for R2015 and onwards.
which resolves the problem perfectly by simplying adding two lines of codes after plot function:
ax = gca;
ax.YAxis.Exponent = 0;
Hopefully it helps others.