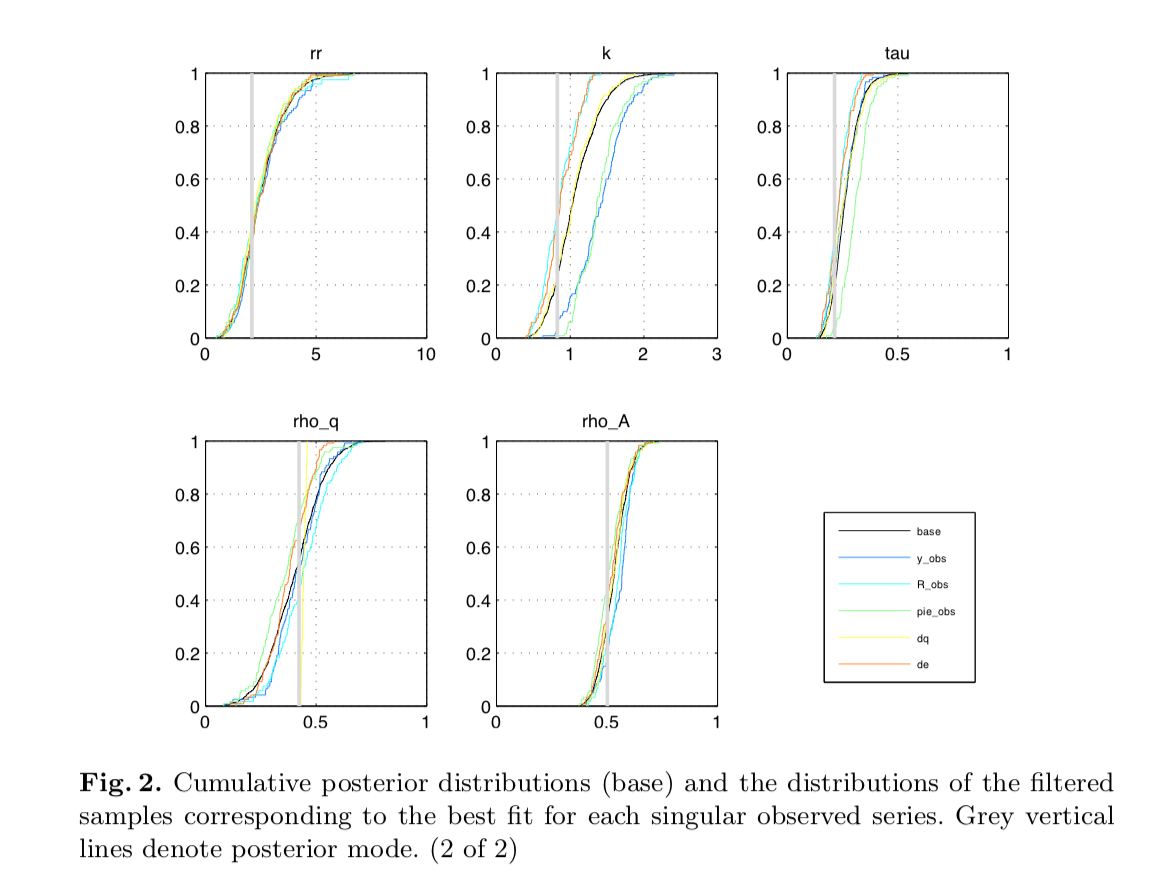
I estimated the model of Quint Rabanal with my own data. For further analysis I want to include the _Mapping of the fit _ as graphs (example as screenshot attached).
However, I am not able to code it properly. Up to now the forum provides limited information about this topic (key words: mapping the fit, RMSE,…)
Up to now I am receiving the error message:
Error using load
Unable to read file ‘estmodel/metropolis/estmodel_data.mat’. No such
file or directory.
Error in filt_mc_ (line 146)
load([DirectoryName filesep M_.fname ‘_data.mat’]);
Error in dynare_sensitivity (line 419)
filt_mc_(OutputDirectoryName,options_gsa,dataset_,dataset_info);
Error in estmodel (line 1446)
dynare_sensitivity(options_gsa);
Dear Professors,
I know that you are doing this in your free time and do not have time to look into every issue more detailed. Thereby, you do a great service by making DSGE models and GSA more common and easier to comprehend its functionalities.
Hence, let me please refresh this topic by asking: Could you please offer some advice on how to produce the posterior cumulative distributions? - I could already produce other GSA results, however still struggle with this one.
I already checked literature from @rattoma and @jpfeifer and the forum. A simple hint (codewise) would already be sufficient, then I can try to implement it on my own.
Please excuse any inconveniences and also the possible triviality of my questions