Jigsawed lines in graphs

Hi professor,

a few questions to consult you:

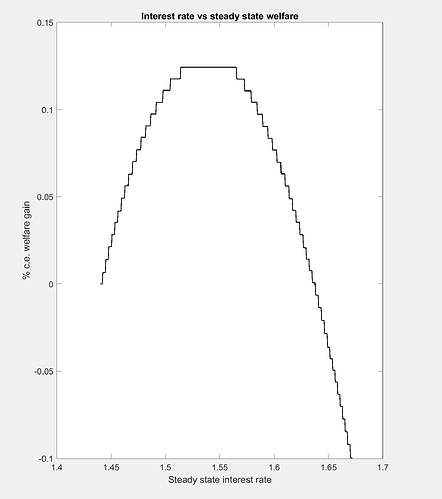
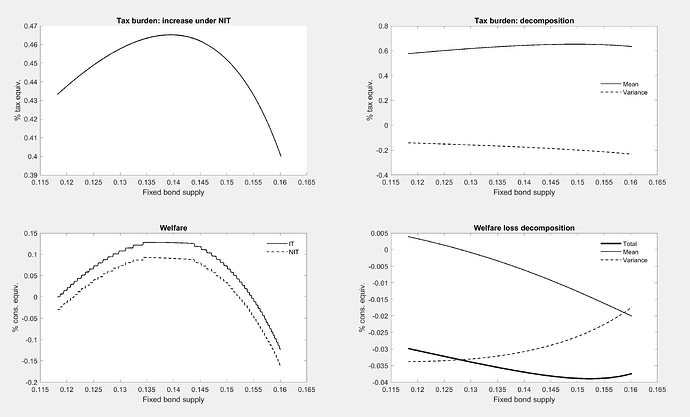
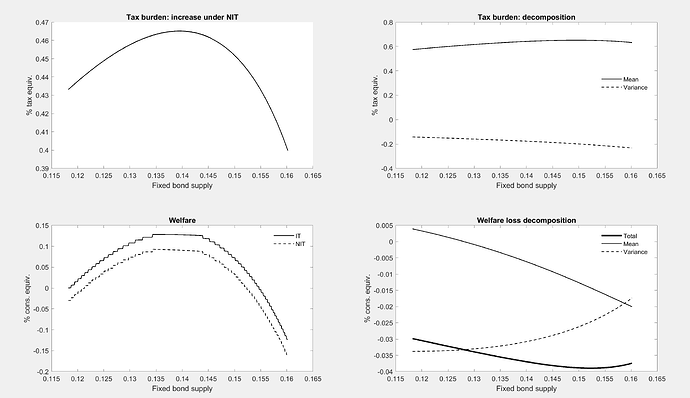
  1. Could you provide some clues as to why the graphs generated by the following 4 files ( 1 mod file + 3 m files) are jigsawed?

part1.mod (4.1 KB)
part4.m (3.0 KB)
part2.m (3.3 KB)
part3.m (2.3 KB)

I’ve tried various means to fix it e.g. by increasing the no. of loops (part 1) from 500 to 5000,or turned on graphics smoothing (part 2)


neither of which seemed to work…


Q2.

It seems the default PDF graphs exported Matlab is portrait instead of landcape. I tried to change it to landscape using the following code

which worked fine, but I am curious if there are other ways to let Matlab automatically save PDF figures using landscape layout.

Q3. it’s odd that the top border of the 1st subplot is missing…do you know what causes this?

Thanks!!
The NGDP_steady_state.m is missing.

Sorry, here it is!

NGDP_steady_state.m (388 Bytes)

Now Loop_record is missing.

I am re-uploading all the files again here:

NGDP_Baseline_Run_1.m (3.1 KB)
NGDP_Baseline_Run_2.m (2.3 KB)
NGDP_steady_state.m (388 Bytes)
Loop_record.m (680 Bytes)
NGDP_2024_Baseline.mod (4.1 KB)
NGDP_Baseline_Plotter.m (3.2 KB)

Hi, professor, could you provide some hints about what has gone wrong?

The staircase pattern comes from Lambda_SS being identical for several neighboring values.

1 Like

thanks for your hint!

The issue has been resolved by adding an additional line of code setting small tolerance level after the “stoch_simul” function:

stoch_simul(order=2, drop=0, periods=0, irf=0, noprint);

options_.solver_tolf = 1e-10; // set function tolerance

1 Like