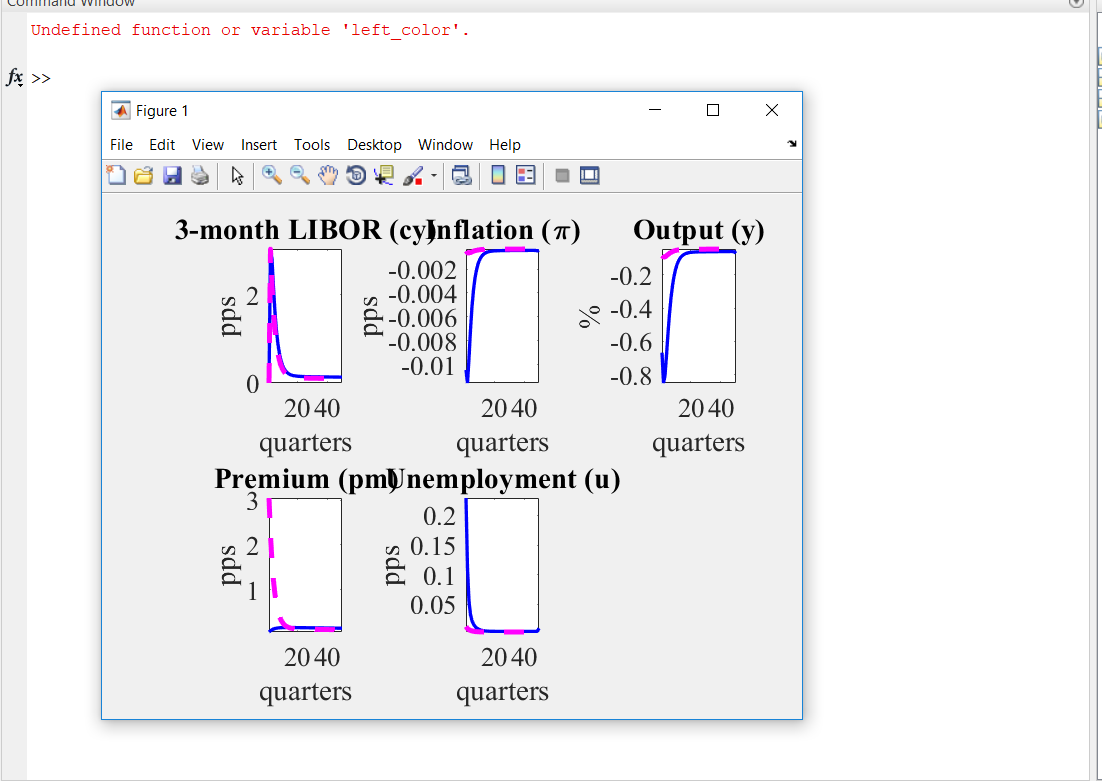
I am still not sure I get what you are trying to do. How about
clear all; close all; clc;
load ert.csv;
load eprt_nocrisis.csv;
hh=figure;
subplot(2,3,1)
plot(ert(:,12),'b','LineWidth',2)
hold on;
plot(eprt_nocrisis(:,12),'m--','LineWidth',3)
xlabel('quarters')
ylabel('pps')
title('3-month LIBOR (cy)');
axis tight;
set(gca,'FontSize',16, 'FontName','Times')
ax = gca;
ax.YAxis.Exponent=0;
subplot(2,3,2)
plot(ert(:,5),'b','LineWidth',2)
hold on;
plot(eprt_nocrisis(:,5),'m--','LineWidth',3)
title('Inflation (\pi)');
xlabel('quarters')
ylabel('pps')
axis tight;
set(gca,'FontSize',16, 'FontName','Times')
ax = gca;
ax.YAxis.Exponent=0;
subplot(2,3,3)
plot(ert(:,8),'b','LineWidth',2)
hold on;
plot(eprt_nocrisis(:,8),'m--','LineWidth',3)
title('Output (y)');
xlabel('quarters')
ylabel('%')
axis tight;
set(gca,'FontSize',16, 'FontName','Times')
ax = gca;
ax.YAxis.Exponent=0;
subplot(2,3,4)
plot(ert(:,11),'b','LineWidth',2)
hold on;
plot(eprt_nocrisis(:,11),'m--','LineWidth',3)
title('Premium (pm)');
xlabel('quarters')
ylabel('pps')
axis tight;
set(gca,'FontSize',16, 'FontName','Times')
ax = gca;
ax.YAxis.Exponent=0;
subplot(2,3,5)
plot(ert(:,16),'b','LineWidth',2)
hold on;
plot(eprt_nocrisis(:,16),'m--','LineWidth',3)
title('Unemployment (u)');
xlabel('quarters')
ylabel('pps')
axis tight;
set(gca,'FontSize',16, 'FontName','Times')
ax = gca;
ax.YAxis.Exponent=0;
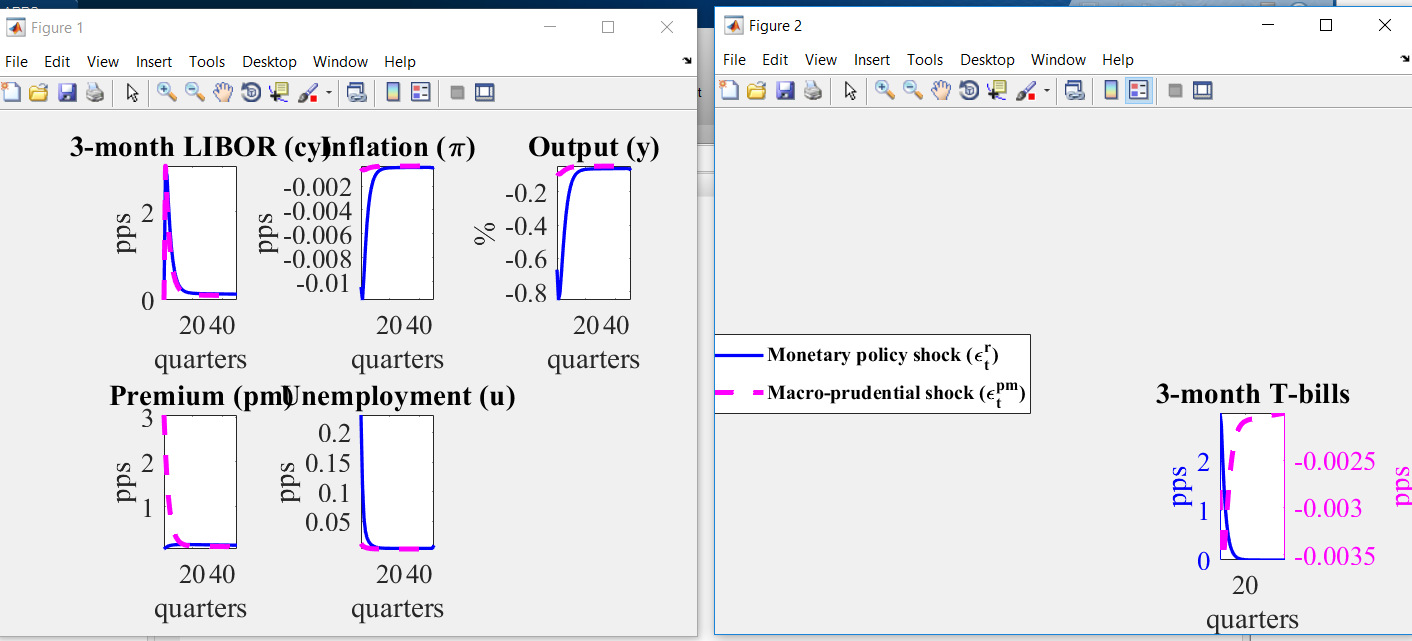
left_color = [0 0 1];
right_color = [1 0 1];
hh2=subplot(2,3,6)
set(hh2,'defaultAxesColorOrder',[left_color; right_color]);
yyaxis left
plot(ert(:,1),'b','LineWidth',2)
ylabel('pps')
hold on;
yyaxis right
plot(eprt_nocrisis(:,1),'m--','LineWidth',3)
title('3-month T-bills');
xlabel('quarters')
ylabel('pps')
axis tight;
set(gca,'FontSize',16, 'FontName','Times')
ax = gca;
ax.YAxis(2).Exponent = 0;
Lgnd = legend('Monetary policy shock (\epsilon^r_t)','Macro-prudential shock (\epsilon^{pm}_t)');
set(Lgnd,'FontSize',12, 'FontName','Times','FontWeight','bold');
Lgnd.Position(1) = -0.01;
Lgnd.Position(2) = 0.42;