detrend.zip (3.1 KB)
I recently tried to plot the IRF’s given by dynare by hand in Matlab. That is, I wanted to plot the IRFs of my variables by using the policy function given in Dynare. This is just an exercise for myself so that I can understand DSGE models better.
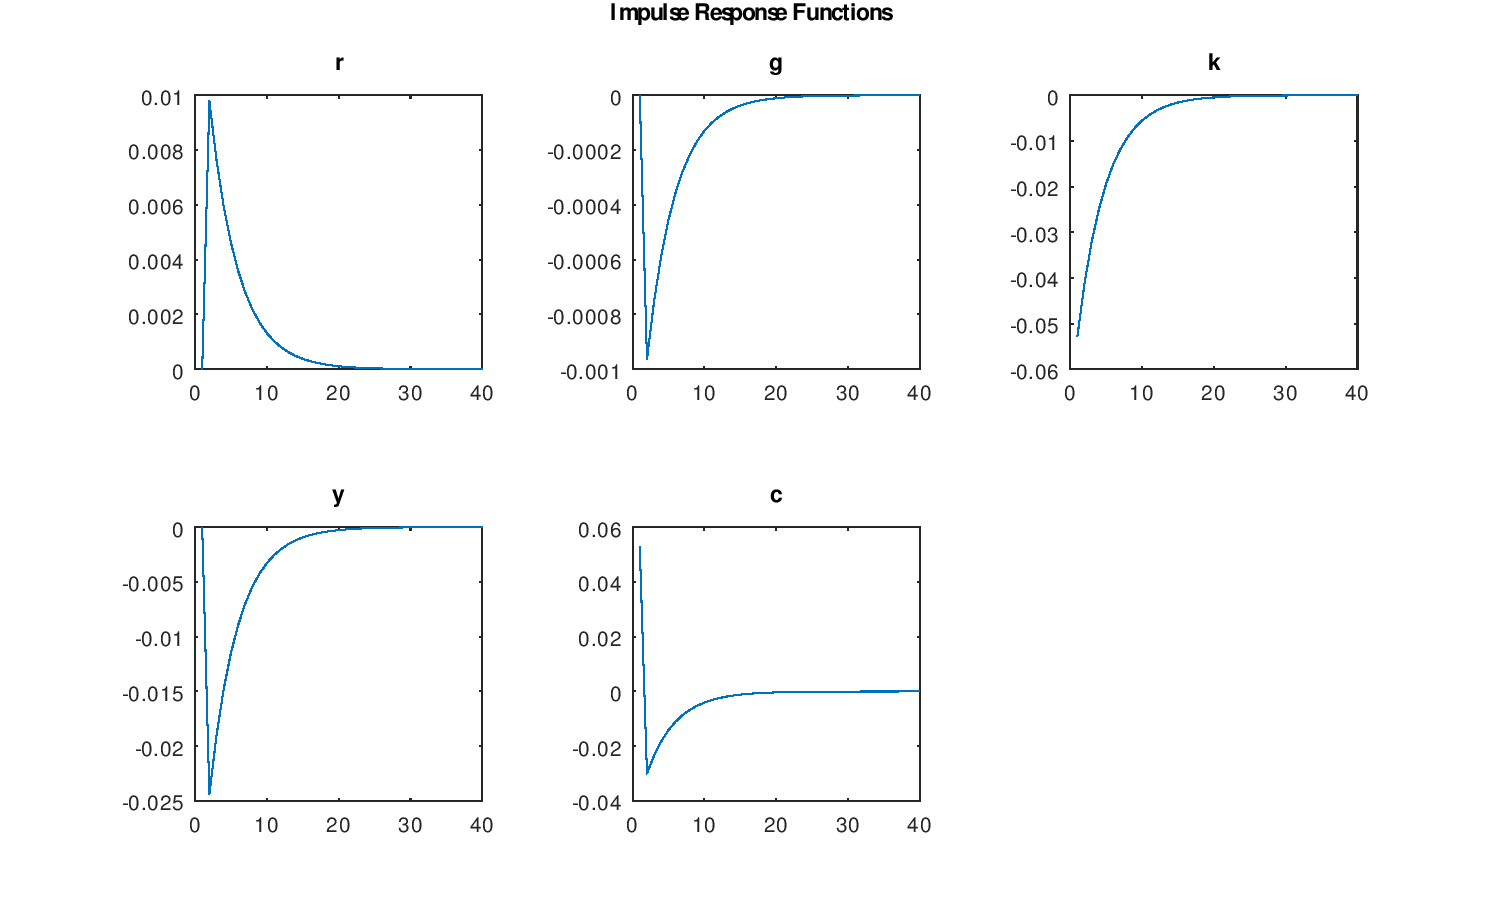
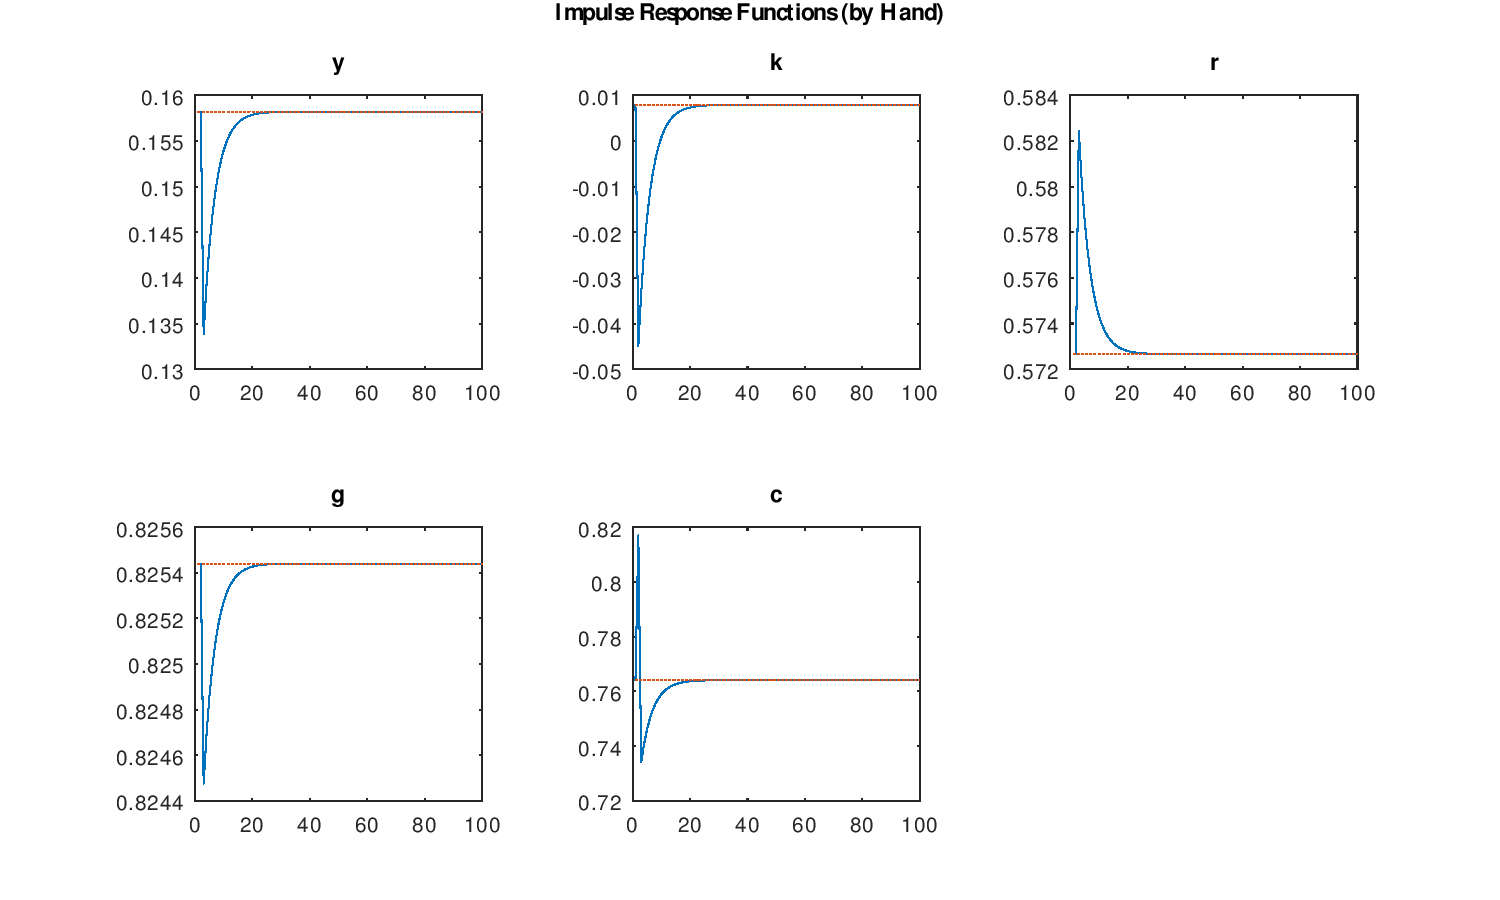
While doing this I get IRFs which look very similar to the IRFs generated by Dynare, but the values on the y axes are different. It feels like Dynare is plotting deviations from steady state instead of absolute values, but I was under the impression that it only did this if you somehow specify it to do so, and I haven’t done that.
It is a first order approximation which I did here, I am attaching both plots, the mod file and the m file I used.
The zip file contains all the .m and mod files. The pngs of the IRFS are attached seperately.
To run the model, just run the “AA_runmodel.m” file.
The actual dynare model is specified in “detrended_model.mod”.
The .m file which tries to plot the IRFS from the policy function is in “irfs_byhand.m”
Thank you.