Dear All,
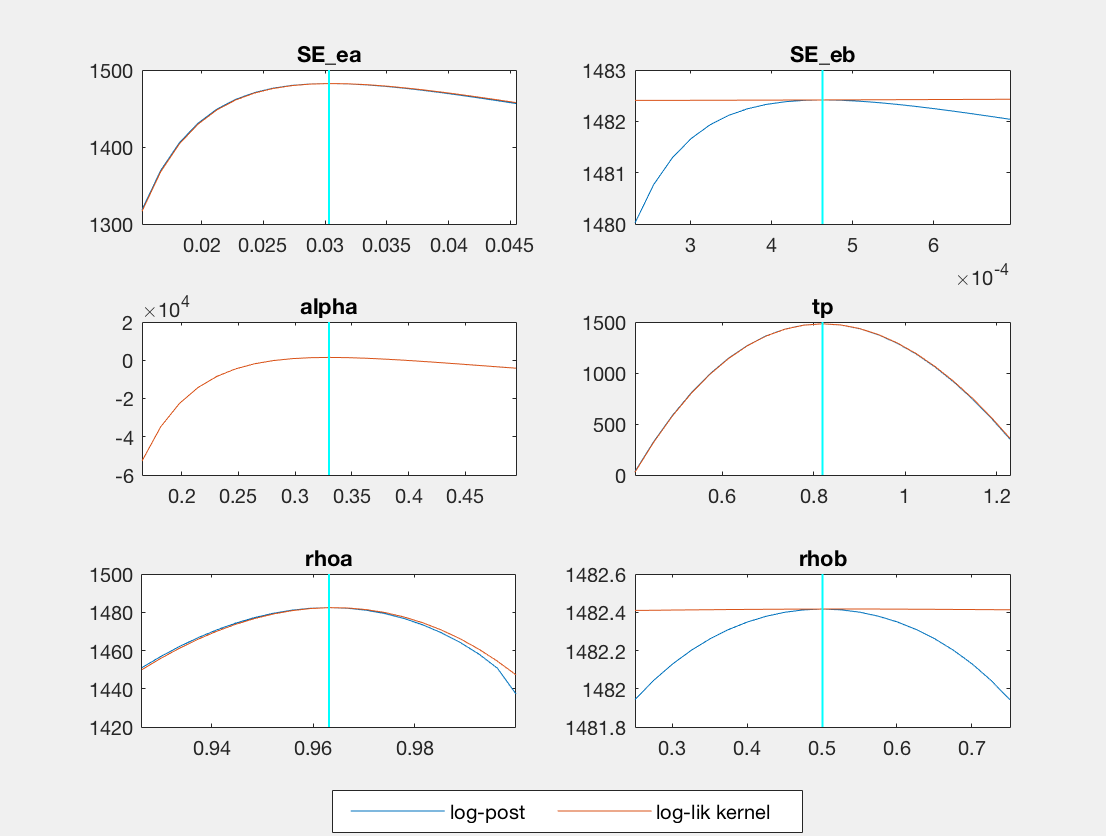
See attached two figures from my Bayesian estimation of a fairly simple DSGE model. The model is estimated on data simulated from the model, and all the parameters seem to be estimated pretty well, with the exception of rhob. For the first figure, mode_check, I have one question:
(1) For the alpha and tp parameters, I don’t see the log-posterior. Is this because the log posterior is exactly on top of the log-likelihood?
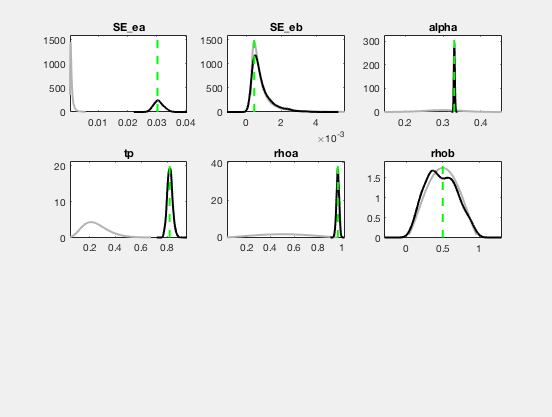
For the second figure, spike_alpha, I have two questions:
(1) Is it worrying that there is such a large spike in the posterior of alpha? The spike is exactly at the actual value of alpha (remember this is using simulated data), but still it seems a little strange to me.
I have also attached the dynare code that generates these graphs.
All the best and thanks,
Jake
testy.mod (5.7 KB)