Hi all,
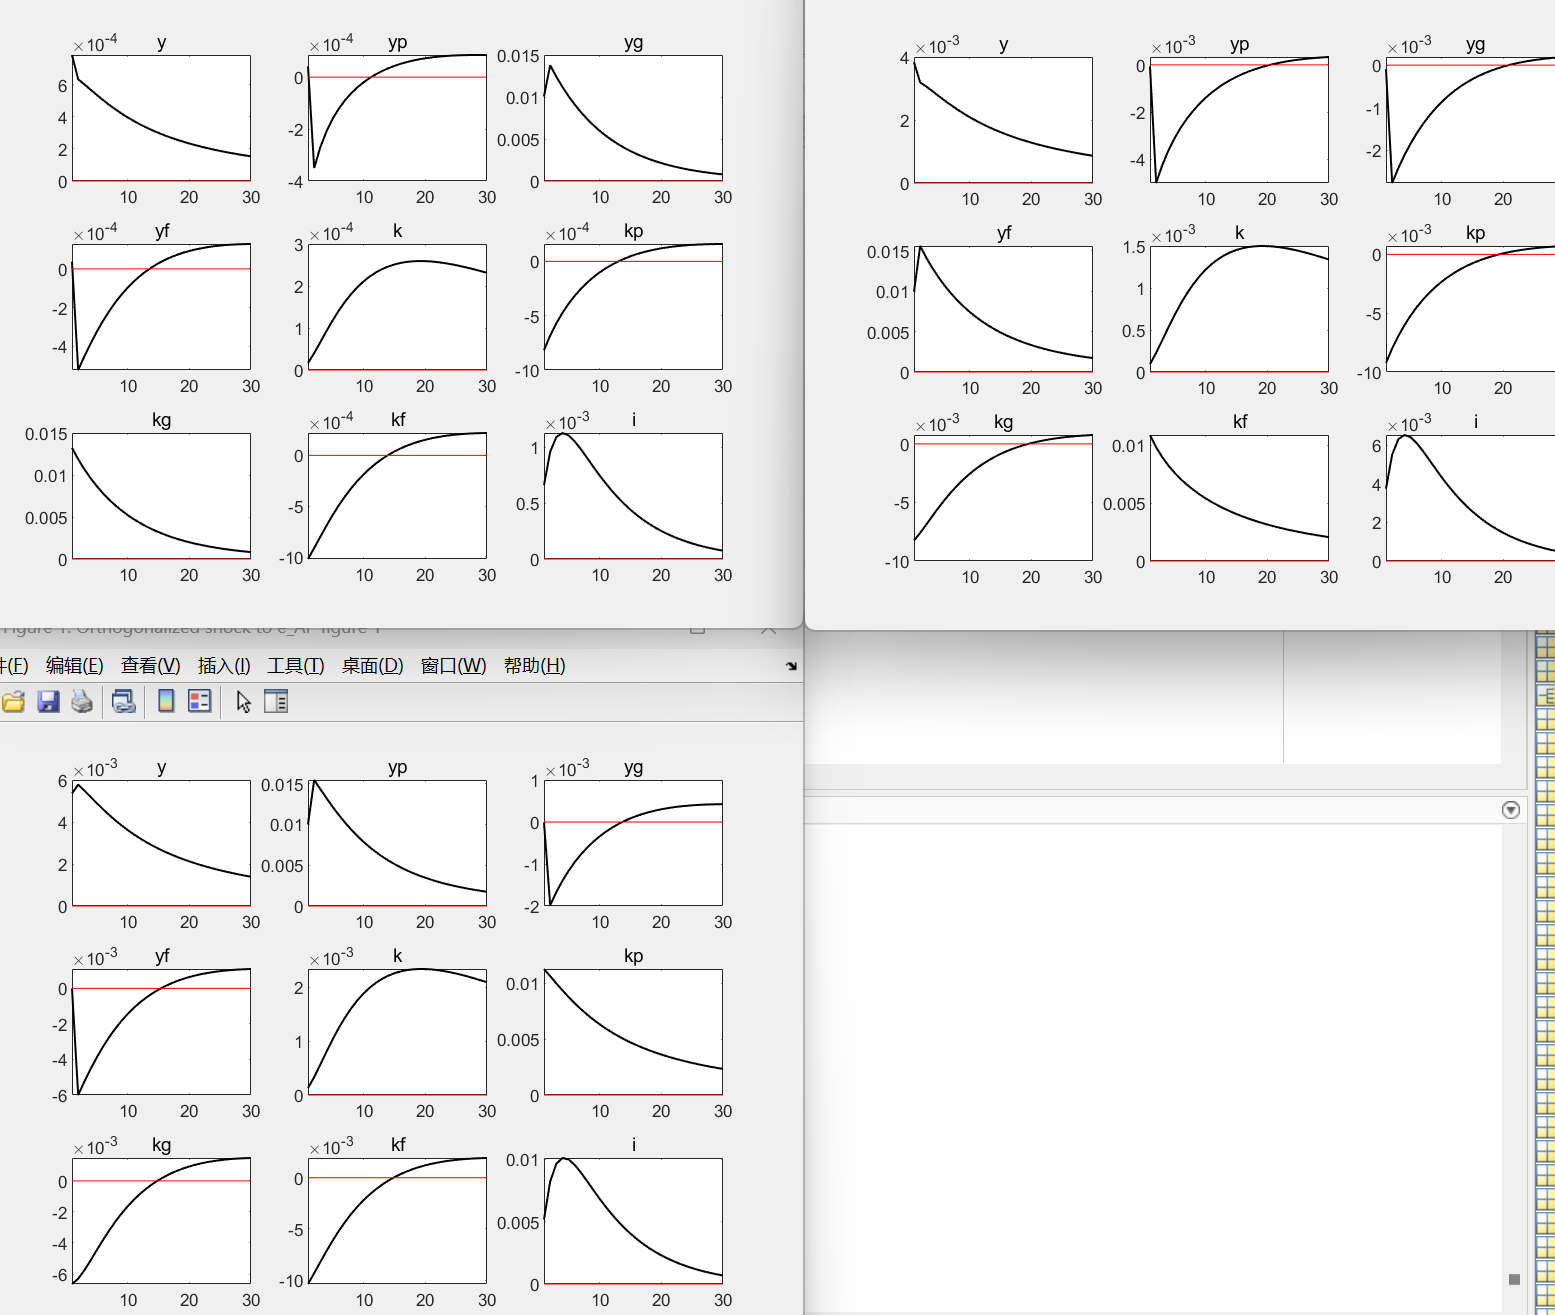
I’m working on a DSGE model in Dynare and encountered a strange issue with the impulse response functions. When I simulate an orthogonal shock to one of the exogenous processes (specifically e_AF and e_AG), I find that the impulse responses of output (y) and its components (yp, yg, and yf) all exhibit an unusual V-shaped pattern: they initially drop sharply and then gradually recover, even though the shock is positive. Is this pulse chart trend normal? What causes this result?
rbc.mod (3.9 KB)