Hi everyone (first post here),
I am trying to replicate some figures from Carlstrom & Fuerst (1997).
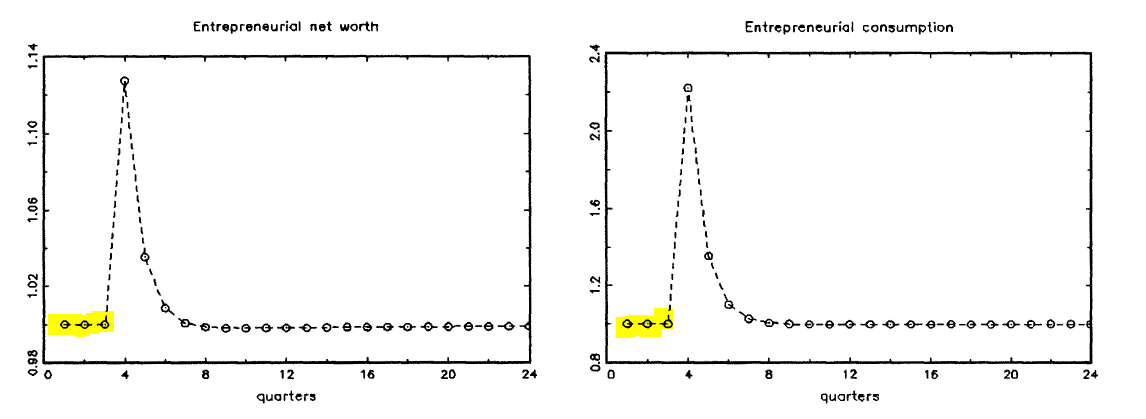
Their figures include the impulse response functions with a few periods before a shock (in steady-state):
I know this question has already been asked, but I do not understand the code that Johannes Pfeifer provided as a solution:
plot([-5:options_.irf],[zeros(6,1); y_e])
https://archives.dynare.org/phpBB3/viewtopic.php%3Fp=12907.html
- Where do I use this bit of code?
- Where can I find documentation on plot(,)?
I will be very grateful if anyone can explain how to do this in Dynare.
CF97.mod (3.1 KB)