Greetings!
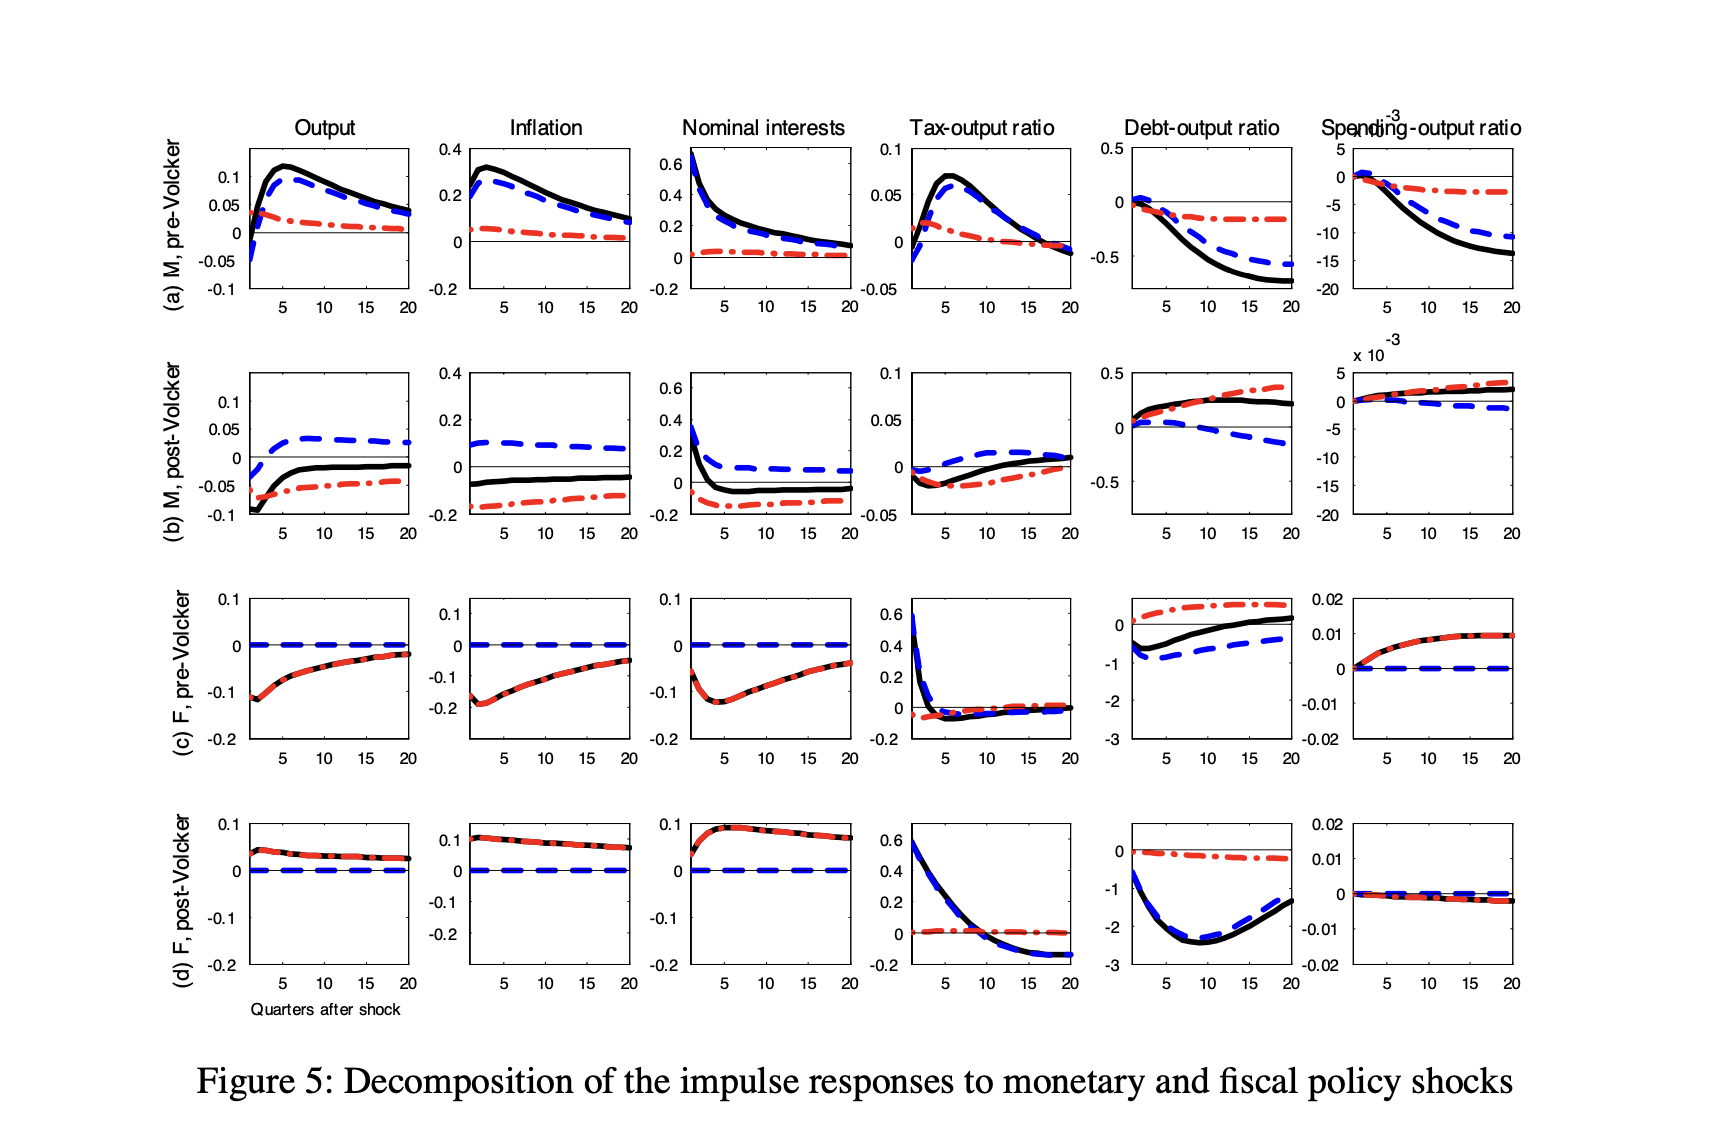
Recently I been reading “Policy Regimes, Policy Shifts, and U.S. Business Cycles” by Bhattarai et. al.
- In that paper the author displayed a decomposition of impulse response, which show the determined and undetermined part of initial impact of shock. I’m little confused about this explanation, How can I plot the similar graph?
I’ve tried “simul” by setting only one shock above 0, and other to be 0, the result however different.
- They plot the harmonic-mean marginal log-likelihood each step, I wonder if dynare store the intermediate results somewhere (because I learned the harmonic mean estimator marginal log-likelihood can be called by oo_.MarginalDensity)

