Dear Dynare members,
I am a Dynare novice and have been doing some Dynare exercises recently. I want to make a superposition shock, which means to add a money supply shock to the labor shock, but I use the following command to realize the independent influence of the above two shocks on the variables.
The orders I use are as follows:
shocks;
var eN;
stderr 1;
var em;
stderr 0.1;
end;
Finally, please let me describe my problem again,I want to make a model that includes the simultaneous superposition of labor and money supply shocks, and show the results of the two shocks on a graph. This is my model filesimulation_a.mod (3.0 KB) .Looking forward to your reply!
You can do this using the simult_-function. See https://github.com/JohannesPfeifer/DSGE_mod/blob/master/RBC_news_shock_model/RBC_news_shock_model.mod for an example.
But note that at first order, the IRF to a joint shock is simply the sum of the IRFs to the individual shocks due to linearity.
Thank you for your reply, I made some changes to the code you provided, but the result was a little strange, and I don’t understand which code is fulfilling my requirements:
shock_matrix(1,strmatch(‘eps_z_news’,M_.exo_names,‘exact’)) = 1; shock_matrix(1+8,strmatch(‘eps_z_surprise’,M_.exo_names,‘exact’)) = -1;
y2 = simult_(M_,options_,initial_condition_states,oo_.dr,shock_matrix,1);
y_IRF = y2(:,M_.maximum_lag+1:end)-repmat(oo_.dr.ys,1,options_.irf);
figure
subplot(2,1,1)
plot(y_IRF(strmatch(‘y’,M_.endo_names,‘exact’),:));
title(‘Output’);
subplot(2,1,2)
plot(y_IRF(strmatch(‘z’,M_.endo_names,‘exact’),:));
title(‘TFP’);
The above code produces a diagram,is this a picture of the impact offset,or is the following set of code?
figure
for ii=1:M_.orig_endo_nbr
subplot(3,3,ii)
if max(abs(y_IRF(ii,:)))>1e-12 %get rid of numerical inaccuracies 消除数值误差
plot(y_IRF(ii,:));
else
plot(zeros(options_.irf,1));
end
title(deblank(M_.endo_names(ii,:)));
end
My last question is, what does the above two code-generated diagrams mean?
This is my codesimulation_a.mod (4.3 KB)
The graphics generated by my two pieces of code are also very strange, and I want to know the reason.
Thank you again!
You need to set
shock_matrix(1,strmatch('eN',M_.exo_names,'exact')) = 1;
shock_matrix(1,strmatch('em',M_.exo_names,'exact')) = 0.1;
Both shocks are supposed to happen in the first period. You also need to adjust the number of subplots. See
simulation_a.mod (4.3 KB)
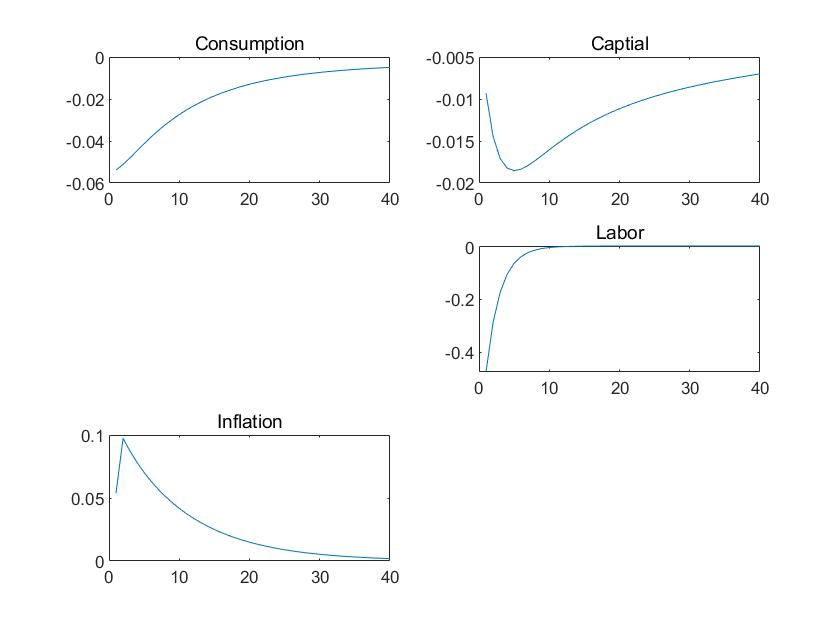
Professor Feifer, thank you for your reply. After running the code you sent me, I have two questions, one is in picture 3, there are some subgraphs not listed, what is the reason?
Two is what does picture 3 and picture 4 explain respectively?
- You did not adjust the subplots correctly:
subplot(3,2,2)
plot(y_IRF(strmatch('Y',M_.endo_names,'exact'),:));
title('Output');
subplot(3,2,2)
plot(y_IRF(strmatch('K',M_.endo_names,'exact'),:));
title('Captial');
uses the second plot twice instead of using the third one.
2. Your “Picture 3” is the IRFs of the variables you selected while “Picture 4” is the IRFs for all variables.
Thank you very much for your reply. I would like to say what I understand now: picture 3 and picture 4 are all pictures of joint impact, but picture 3 is my choice, picture 4 is all variables,
Thank you very much for your reply!
Dear Professor Feifer,
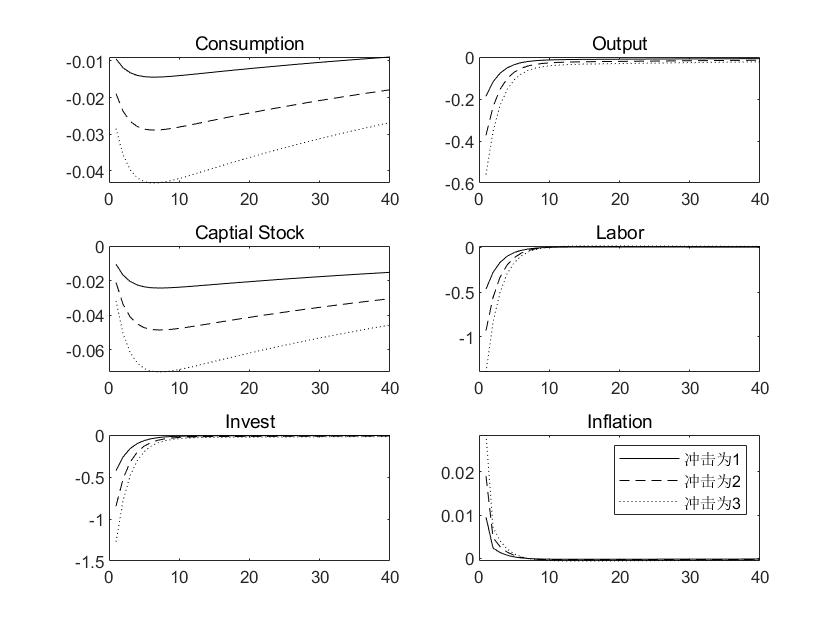
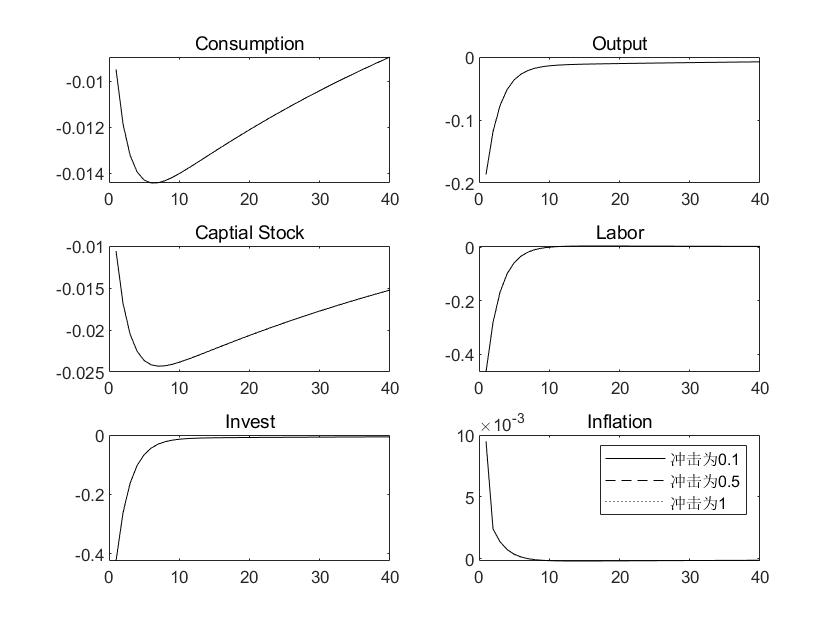
I encountered a new problem in my work, I divided the size of the currency shock em in the mixed shock into three different values ,0.1,0.5 and 1, respectively, and I wanted to draw these three different situations on a graph.
I wrote a code that works well when combining the IRF of a labor shock eN with different values, as shown below:
When I used the same code to describe a composite impact diagram, there was a problem, and the result showed that it did not draw a different combination impact on a diagram
So, what’s wrong with my code? what factors cause my combination impact of the IRF map can not be drawn together?
Finally I will provide my model file,This is the model file I can implement for labor shocks
eN.zip (5.3 KB)
This is the model file I can’t implement for mix shocks
mix.zip (10.0 KB)
Looking forward to your reply!
You are trying to use Dynare’s buitin IRFs when you try to load outputc = oo_.irfs. But you created IRFs yourself and stored them in e.g. y_IRF(strmatch('pi',M_.endo_names,'exact'),:). That cannot work.
Thank you for your reply. Perhaps because I am a Dynare novice, I have no idea. Could you say something more?Many many many Thanks!
It should be something like
load('m2_a_results.mat')
outputa = y_IRF

load('m2_b_results.mat')
outputb = y_IRF

load('m2_c_results.mat')
outputc = y_IRF

%load('simulation_a_results.mat')
%outputd = oo_.irfs


 t=[1 2 3 4 5 6 7 8 9 10 11 12 13 14 15 16 17 18 19 20 21 22 23 24 25 26 27 28 29 30 31 32 33 34 35 36 37 38 39 40]';

var_names={'C','Consumption'
    'Y','Output'
    'K','Capital'};

for var_iter=1:size(var_names,1)
   subplot(3,2,var_iter);
   plot(t,outputa(strmatch(var_names(var_iter,1),M_.endo_names,'exact'),:),'- k',t,outputb(strmatch(var_names(var_iter,1),M_.endo_names,'exact'),:),'--k',t,outputc(strmatch(var_names(var_iter,1),M_.endo_names,'exact'),:),':k')%,t,outputd.C_eN,':k')
   title(var_names(var_iter,2));
end
Thank you very much, Professor jpfeifer. I’ve done it.