I know it is possible to convert the historical shock decomposition from dynare into Excel format.
but I am wondering if it is possible to conduct a similar study as shown in the pic given the shock decomposition results from dynare?
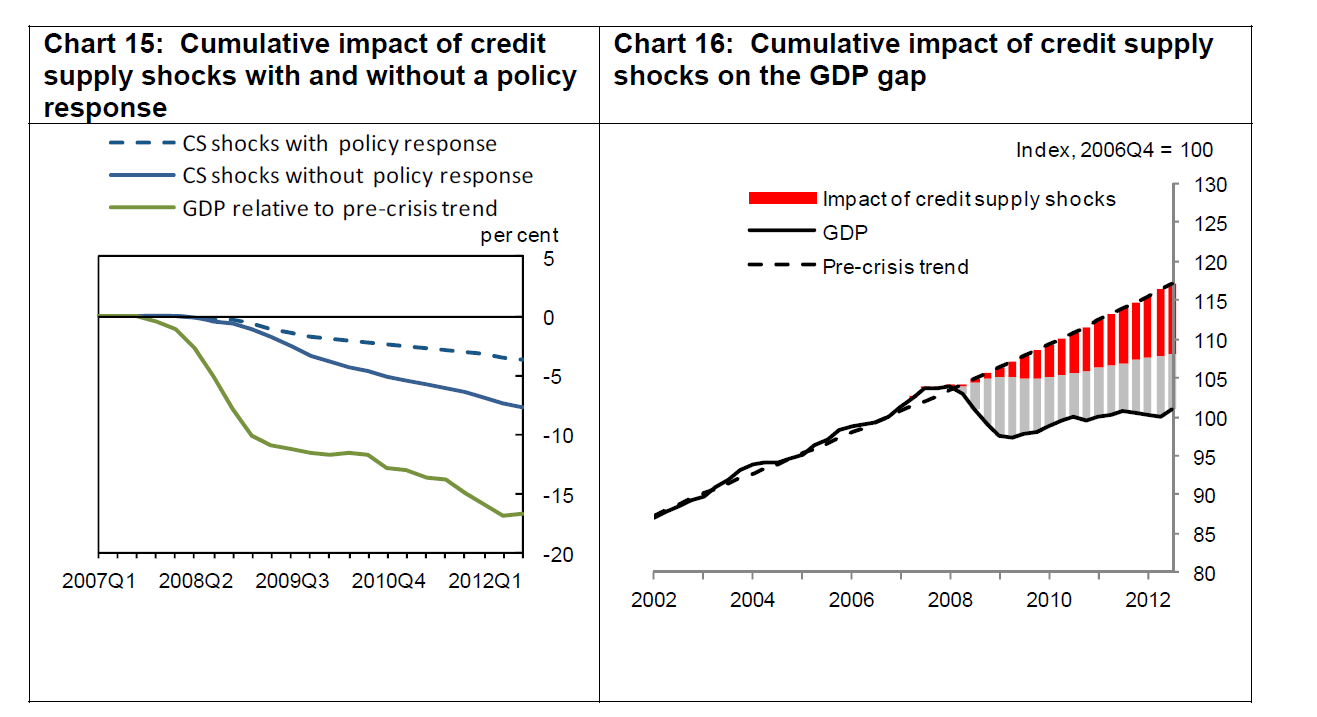
for pic1, I want to replicate the green and blue line part ( ignoring the dashed blue line),
given that what I have access to is the shock decomposition results for GDP ( including effects from individual shocks) spanning the period 1986-2016.
for pic2, I suppose output gap part could be done with Excel, but how I am supposed to show the cumulative impact of one paricular shock?
I am not sure what the question is. Is the question whether Excel can do such a plot? Or whether shock_decomposition provides all the output required for the graphs? If the latter, then you need to tell us what the lines in the graphs are. The historical decomposition does not allow do counterfactual (“without policy response”). For that, you need to run the decomposition twice, once on a model with and without the policy.
Regarding the right panel, you need information on the trend component you took out of your data, but apart from that, it should work.
for pic1, I got your point. but I would also like to know if my full sample period spans from 1986-2016, and I want to replicate pic1 ( with sample period covering 2007-2012), do I need to start it over doing another shock decomposition with data starting from 2007, or could I just abstract info from full sample period (1986-2016) shock deomcomposition?
for pic2, how am I supposed to know the trend component removed from my data?
if the results were provided by dynare, how long the pre-crisis period used to generate the trend should cover?
for pic2, the outgap obviously was calculated based on the pre-crisis period, which excluded the post-crisis period (2008-2012)
however, I suppose the trend component taken from the data by Dynare was based on full sample period? (including the post crisis period).