Graphs in Dynare Julia

Hello to everyone,

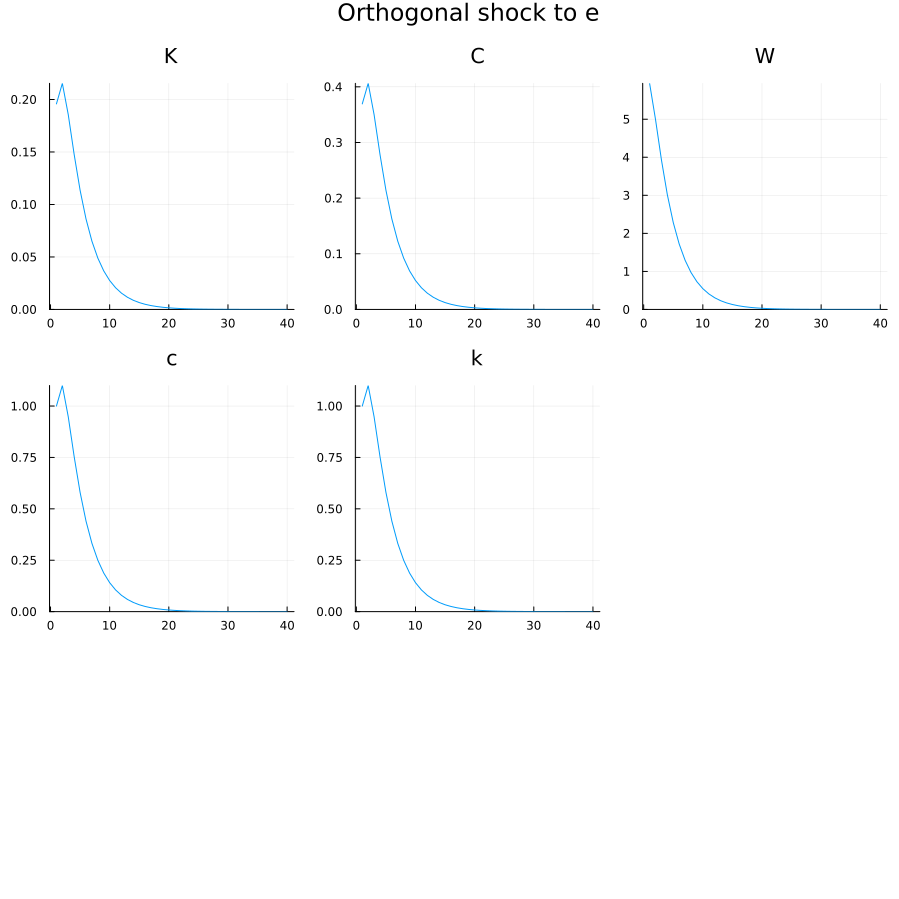
Using the Dynare package in Julia I have noticed that the last variable ordered is not being plotted after stock_simul(order=1). That is if var K C W c k A; the variable A is omitted in the plot. Here is an example code.


var K C W c k A;
varexo e;

parameters alpha delta beta rho; 

alpha = 0.35;  % Parameter values
delta = 1;
beta=0.99;
rho = 0.75; 

model;
1/C=beta*(1/C(+1))*(1-delta+alpha*A(+1)*K^(alpha-1));
K=A*K(-1)^alpha-C+(1-delta)*K(-1);
W=log(C)+beta*W(+1);
log(A)=rho*log(A(-1))+e;
k=log(K);
c=log(C);
end;

initval;
C=1;
K=1;
A=1;
W=-10;
c=1;
k=1;
end;

shocks;
var e; stderr 1;
end;

steady;

stoch_simul(order=1);

Does anyone know why this may be happening?

Thank you very much.

Thank you for reporting the problem, Santiago.

I just fixed it in Dynare.jl v0.9.16.

Best,

Thank you very much.

How do I plot customized impulse responses in dynare Julia? I have tried context.results.model_results[1].irfs[:enu] but I cannot access the individual IRFs to plot them as I please. Many thanks in advance.

context.results.model_results[1].irfs[:enu] return the IRF of all endogenous variables for a shock to exogenous variable enu
If you want only the IRF fo variable y, use

context.results.model_results[1].irfs[:enu][:y]

PS: it is better not to write at the end of an old post but to open a new topic

Merci Michel! I figured it out in the end.
I am new to Julia. I can to see the function that plots the IRFs. I opened a new post.