Hi every one
I often see that after estimation, people often plot the actual data vs fitted data, for example, here (Figure 1, page 490 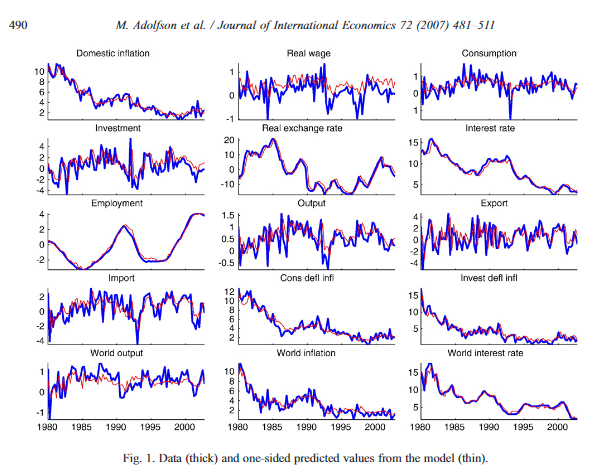 )
)
My question is how I can generate such kind of predicted value after the Bayesian estimation in Dynare
Thank you so much indeed
Best wishes