Dear community,
I hope you are doing well!
My problem is the following:
Taking into account the following code:
t_pos=strmatch(‘T’,M_.endo_names,‘exact’);
tl_parameters = 0.01:0.01:0.6;
ts_parameters = 0.01:0.01:0.6;
[ts_mat, tl_mat]=meshgrid(ts_parameters,tl_parameters);
temp_mat=NaN(size(tl_mat));
for ts_iter=1:length(ts_parameters)
for tl_iter=1:length(tl_parameters)
set_param_value(‘tl’,tl_mat(tl_iter,ts_iter));
set_param_value(‘ts’,ts_mat(tl_iter,ts_iter));
[oo_.steady_state,M_.params,info] = steady_(M_,options_,oo_);
if ~info
temp_mat(tl_iter,ts_iter)=oo_.steady_state(t_pos);
end
end
end;
contour(tl_mat,ts_mat,temp_mat,temp_mat(26,16));
The resulting figure shows a circle. I am interested in the part of the figure that is smaller than the line defined by the next equation:
Y = 0.48-1.2*X; for X = 0.01:0.01:0.6;
(with X=tl and Y=Ts)
The problem is that I don’t know how to introduce this condition in the code. I need your help and thanks.
Without a full code and a lot more context, it is impossible to provide any advice.
You will find the full code enclosed.
ddd.mod (2.2 KB)
If you have compiled the file, you will find the following figure.
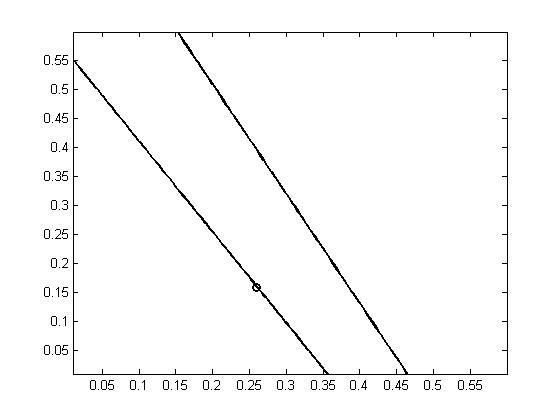
You observe two schemes (two lines) are given! and I want to indicate for the code to delete the superior line, passing throught (0.47;0).
You are plotting a whole set of contour lines. Why would you only plot one line? You might want to deviate from the pre-existing code and simply directly plot what you would like to have.
I would have to eliminate the higher part because it is impossible to do! It’s not real otherwise. So, I should do it with the code, because I expect the code would be submitted to the journal too! So, I should solve this problem. I’ll wait & search a little bit more. Thank You Professor @jpfeifer .
But you still did not tell us what you are trying to achieve. My guess is you are looking for a policy frontier with
[MM,II] = max(M)

plot(taul_mat(:,1),tauss_mat(1,I))
xlabel('\tau_l')
ylabel('\tau_{ss}')
hold on
plot(taul_mat(II,1),tauss_mat(1,I(II)),'+')