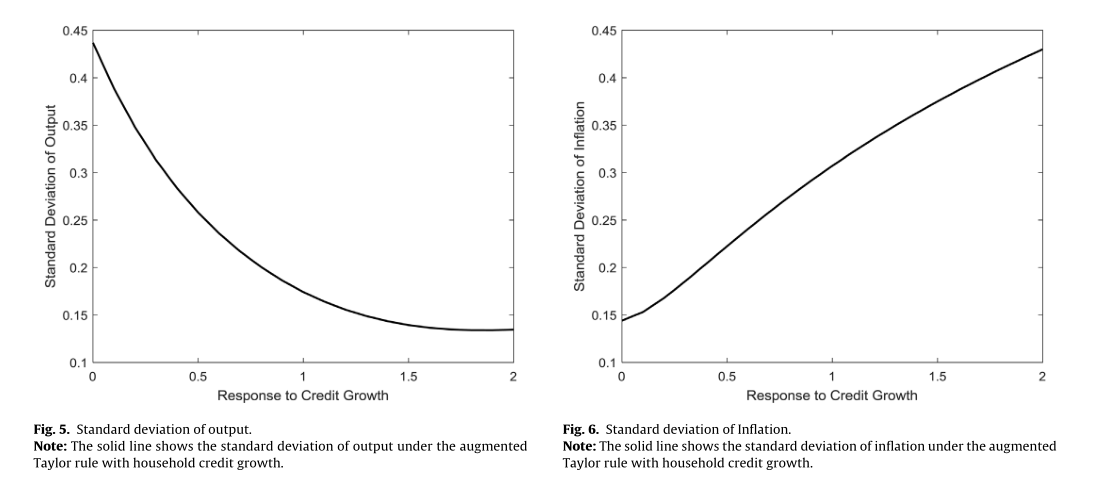
I’d like to know how to draw this kind of chart.Its abscissa is the size of the exogenous parameter, and the ordinate is the standard deviation of the internal variable.Thank u for help!
bekiros2020.pdf (1.8 MB)
I’d like to know how to draw this kind of chart.Its abscissa is the size of the exogenous parameter, and the ordinate is the standard deviation of the internal variable.Thank u for help!
That looks like a Policy frontier exercise