Hi,
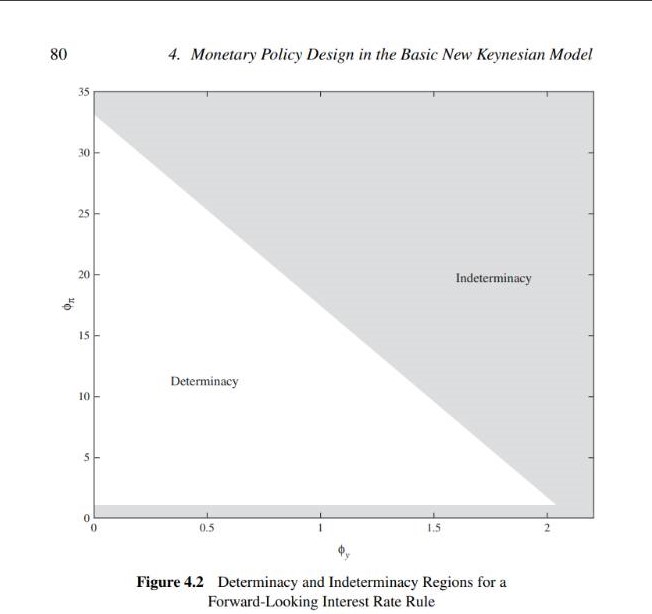
I’m working with a non-linear DSGE model that has two steady states. Depending on the initial values, the steady-state outcome changes. I need to differentiate between stable and unstable steady states for different parameter values and visualize them on a graph (similar to the attached example). Could anyone assist me with this?
You need to elaborate a bit more what you are trying to do and where the challenge is. Determinacy is usually a local property, not a global one. Do you want to alter the approximation point or how do you deal with nonlinearity?
Thank you for your response.
The issue is that in my code, there are two steady-state solutions. We need to select one of them. Naturally, one of the criteria is determining which solution is stable and which is unstable for different parameter values.
We have also solved the model nonlinearly. So it is possible to have stable and unstable steady states.
Thanks.
Is this a Dynare question? Here I wouldn’t know how to implement this. What do you mean with
?
And how did you solve the model nonlinearly?
Let me elaborate further.
When solving our steady-state (SS) model using Dynare or MATLAB, we encounter two steady-state solutions. This occurs because the model is nonlinear, and we intentionally avoided linearizing it to preserve certain nonlinear dynamics.
I understand that determinacy is a local property, and we need to identify the parameter ranges for which the model remains stable around each steady-state. One approach is to linearize the model around each steady-state and compute the eigenvalues as functions of the parameters. However, deriving an analytical solution for this is challenging.
To address this, we need to develop a Dynare or MATLAB code to numerically determine the stability conditions and plot the stability regions in a graph based on two key parameters. This visualization would help illustrate how stability depends on these parameters across both steady-states.
Thank you!
It seems to be the answer to my question but when I run the code with " define determinacy_plot=1", the following error will be shown.
“Error using resol
Too many input arguments.
Error in Ascari_Sbordone_2014.driver (line 522)
[dr,info]=resol(0,M_,options_,oo_.dr, oo_.steady_state, oo_.exo_steady_state, oo_.exo_det_steady_state);
Error in dynare (line 278)
evalin(‘base’,[fname ‘.driver’]);”
How can I fix it?
Thanks