Data of forecast values in Octave

Dear all,
I am estimating a small scale New Keynesian DSGE model. After estimating it, I forecast some variables using the estimation command (for 12 periods). Having done that, the plot of the forecast shows up. However, I struggle to see the data of the forecasted values. I looked in the metropolis and the output folder. They seem to contain the forecast files “forc_mean1.mat”, “forc_point1.mat” and “PointForecast_i.eps”. I am currently using Dynare 4.5.0 on Octave and I am not able to see the 12 forecasted values nor able to open the files above. Furthermore, I tried it with Matlab and the first data file gives me a 5x1200 matrix with zeros and the second a 5x1200 matrix with other values.
Thus, my question: where can I find the data of the 12-period forecasts?
I attached the folders below.

Thank you very much for your help and suggestions.
Kind regards

Folder.zip (2.5 MB)

The files you are looking at are monte carlo draws used to compute the moments of the predictive distribution. The moments you are looking for are stored in the global oo_ structure. All this is explained in the reference manual.

Best,
Stéphane.

Dear Stéphane,
Thank you very much for your quick response. I see the oo_structure in the workspace. When I open it, I get the information about the prior mode and mean. However, the workspace does not display the structures ‘oo_.PointForecast’ or ‘oo_.MeanForecast’. How can I find them?
Thank you again for your kind help.
Best regards,

That is strange. Did your code run properly until the end? As you did not upload a data-file I cannot run the code.

Dear jpfeifer,
Thank you very much for your answer. I assumed to have done the estimation until the end, since the posterior distribution and the forecast show up. I attach the data file below.
Thank you again very much for your suggestions and help.
Kind regards,
daten_log32.m (3.3 KB)

When I run the file, I can clearly see the field oo_.PointForecast.

Dear jpfeifer,
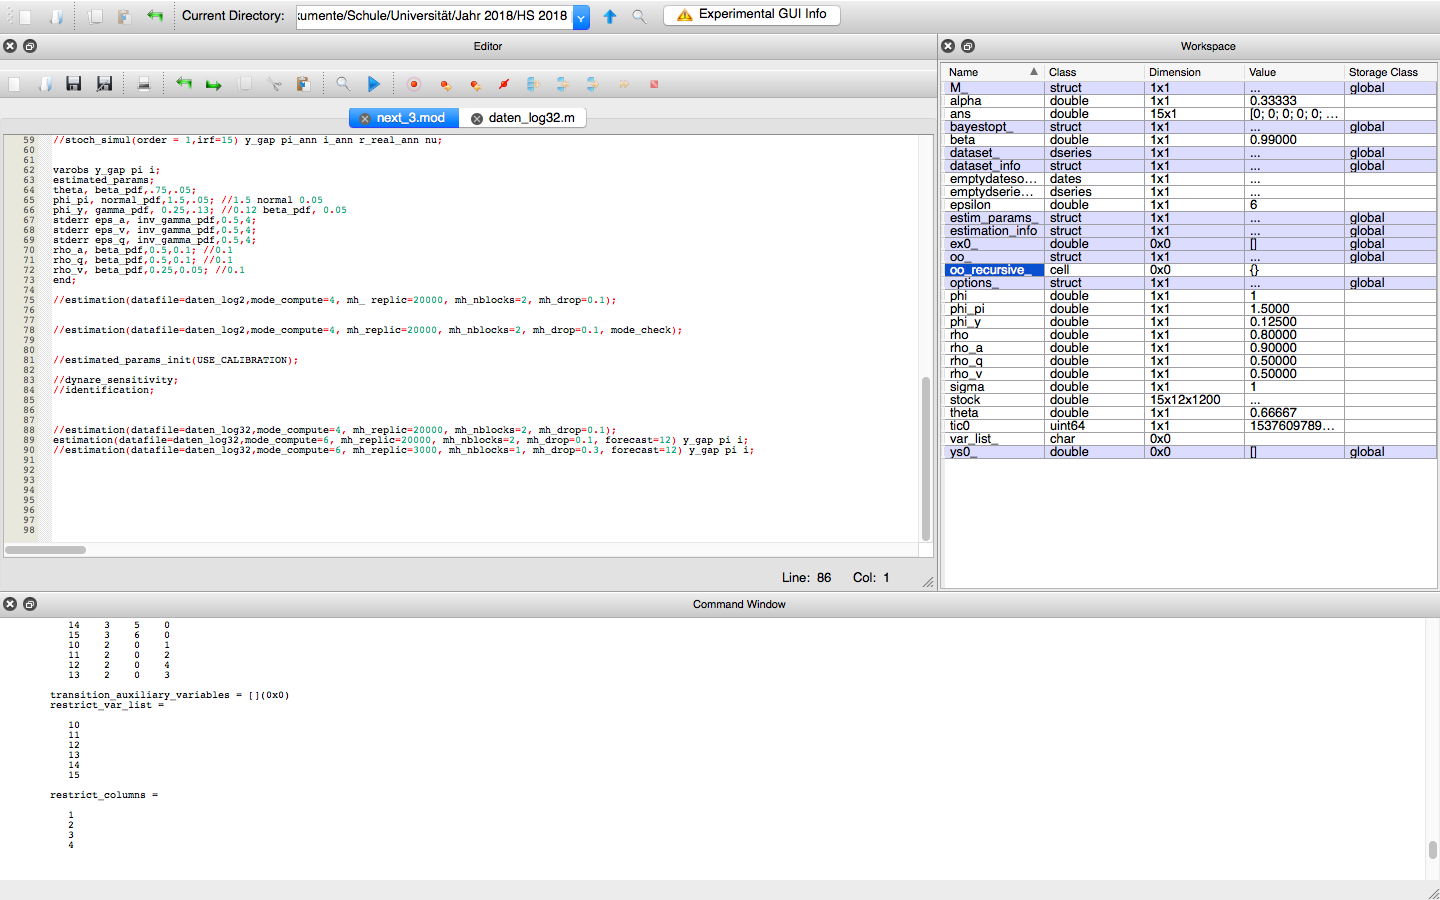
Thank you very much for your time. I added the screenshot of Octave and I believe that the structure is missing. Is that correct?
Could this be a problem with Octave or something else?
Kind regards,

What happens when you type

oo_

into the command window? As you can see, oo_ is a structure with subfields.

I get the following output:

scalar structure containing the fields:

dynare_version = 4.5.0
exo_simul = [](0x0)
endo_simul = [](0x0)
dr =

  scalar structure containing the fields:

    eigval =

       5.6572e-01
       9.0000e-01
       5.0000e-01
       5.0000e-01
       1.1021e+00
       1.2960e+00
       1.8114e+16

    order_var =

        3
        4
        5
        6
        8
       11
       12
       13
       14
        7
        9
       15
       10
        1
        2

    inv_order_var =

       14
       15
        1
        2
        3
        4
       10
        5
       11
       13
        6
        7
        8
        9
       12

    kstate =

       13    3    7    0
       14    3    5    0
       15    3    6    0
       10    2    0    1
       11    2    0    2
       12    2    0    4
       13    2    0    3

    transition_auxiliary_variables = [](0x0)
    restrict_var_list =

       10
       11
       12
       13
       14
       15

    restrict_columns =

       1
       2
       3
       4


exo_steady_state =

   0
   0
   0

exo_det_steady_state = [](0x0)
exo_det_simul = [](0x0)
steady_state =

   0
   0
   0
   0
   0
   0
   0
   0
   0
   0
   0
   0
   0
   0
   0

prior =

  scalar structure containing the fields:

    mean =

       0.50000
       0.50000
       0.50000
       0.75000
       1.50000
       0.50000
       0.50000
       0.50000
       0.25000

    mode =

       0.23153
       0.23153
       0.23153
       0.75694
       1.49333
       0.50000
       0.50000
       0.50000
       0.24306

    variance =

Diagonal Matrix

       1.6000e+01            0            0            0            0            0            0            0            0
                0   1.6000e+01            0            0            0            0            0            0            0
                0            0   1.6000e+01            0            0            0            0            0            0
                0            0            0   2.5000e-03            0            0            0            0            0
                0            0            0            0   1.0000e-02            0            0            0            0
                0            0            0            0            0   2.5000e-03            0            0            0
                0            0            0            0            0            0   1.0000e-02            0            0
                0            0            0            0            0            0            0   1.0000e-02            0
                0            0            0            0            0            0            0            0   2.5000e-03

    hyperparameters =

      scalar structure containing the fields:

        first: 9x1 matrix
        second: 9x1 matrix

As far as I can see, I do not have any information about forecasts.

Thank you again very much for your time and help,
Kind regads,

That is weird. Could you please upload the _results.mat-file created at the end of your Dynare run?

Dear jpfeifer,
Thank you very much for your answer.
I attached the file below.

Kind regards,
next_3_results.mat (907.7 KB)

I can see the subfields related to forecasting in both Matlab and Octave 4.4.1.

Dear jpfeifer and Stéphane,
Thank you very much for your help. I used Octave 3.8 on Mac and I believe that the issue stems from this fact. Hence, I downloaded the new Octave GUI on Mac provided by Octave forge to further this observation. However, the program crashed every tine during the estimation. Do you know if there is a compatible solution for Octave on Mac?

Thank you again for your answer.
Kind regards,

The most recent stable Dynare version 4.5.6 only supports Octave 4.4.0. You need to adjust to that. Or you can use the unstable version with 4.4.1.

Dear jpfeifer,
Thank you very much for your answer. I switched to Windows. However, while using Dynare 4.5.6 and Octave 4.4.0, this error message occured:
due to a bug in octave, you must choose other values for mean and/or variance of your prior on eps_a, or use another shape.
As far as I know, does this result from an incompatible version. Is there a way to fix this?
Thank you again very much for your answer,
Kind regards,

This is a problem with Octave that is not yet solved, as far as I know. As the message says, simply work with a different prior.

Dear jpfeifer,

Thank you very much for your help. I was able to download Matlab and it worked perfectly. However, after using a rolling forecast procedure over a period of 10 observations, I always get the same forecasted output values for the variables. Hence, the mean and point forecasts remain the same over the window. Furthermore, the mean forecast is always zero. Is there a way to generate different forecasts in this respect?

I attached the file for the first and last observation below.

Thank you very much and kind regards,

DSGE.zip (6.8 KB)

Your data is all zero, because of the line

series = zeros(95,3);

y_gap = series(:,1);
pi = series(:,2);
i = series(:,3);

Thus, nothing can happen here.

Dear jpfeifer,
Thank you very much for your answer. It really solved my problem and the forecast is running fine.
Best regards,