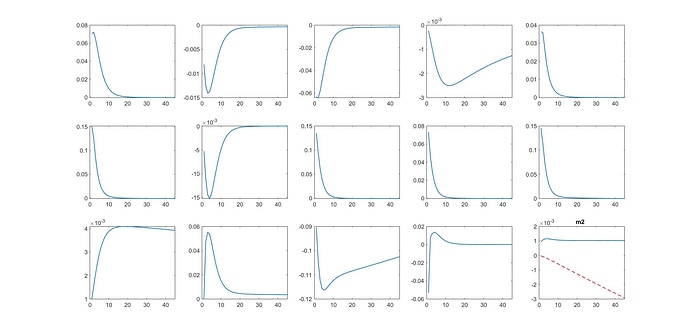
Hi prof,
I have tried to combine IRFs from two excel files for 15 subplots; As I intended to ignore colum 14th, hence I applied to the “i=1,length” loops function, I have tried the code as below:
load IRF1.csv;
print=[1,2,3,4,5,6,7,8,9,10,11,12,13,15,16];
varname=strvcat('r','inv','qq','k','infl','w',...
'c','y','lab','mpk','s','rk','n','m0','m2');

for i=1:length(print)
subplot(3,5,i)
la=plot(IRF1(:,i),'r--')
la.LineWidth=1;
title(varname(i,:));
end;

hold on;

load IRF.csv;
print1=[1,2,3,4,5,6,7,8,9,10,11,12,13,15,16];

for i=1:length(print1)
subplot(3,5,i)
la=plot(IRF(:,i))
la.LineWidth=1;
xlabel('Time period')
ylabel('pp point')


hold off;
end;
However, only the last suplot was successful, please could you help me with the rest 14 subplots? see attached the screenshot and excel files.
IRF1.xlsx (14.3 KB)
