I’m returning to a question I asked a while back. The answer mostly worked, but I’m running into a puzzle. I’ve now got a model with news shocks (4-period lead) to a stochastic trend. I construct the trend B^u from the irf for gu, the growth process for the trend, setting B^u=1 initially. I produce two irfs for each of the endogenous variables ‘c’ and ‘ii’, one for the level and one for the growth rate (‘cg’ and ‘iig’). The trend for ‘ii’ is B^u, the trend for ‘c’ is (B^u)^.33. To get the paths from the level irf I multiply the steady state value by the trend at each period and add the irf value. To get the paths from the growth rate irf I just accumulate the irfs. I then calculate the paths as a percent deviation from the steady states. This works perfectly for investment: the paths from the two irfs constructed this way match. For consumption, the two paths diverge starting at date 5 (when the news shock actually raises the trend).
I can’t figure out why the consumption paths aren’t the same. I’ve also used this method in another model with the same stochastic trend and it works fine for both variables. Something goes wrong here with the consumption variable.
I’m attaching a spreadsheet where I do the above calculations and produce the graphs (easier for me to do in Excel). I’ve also attached the mod file and data file, but I don’t think that’s the source of the problem, so it shouldn’t be necessary to run it.
Even for investment, the IRFs show differences. Are you sure your formulas are correct? It may be that the reconstruction of the IRFs from the elements is only correct up to first order, e.g. you replace geometric by arithmetic compounding or something like that.
I’m pretty sure they’re correct, as they’ve always worked with other variables and other models. I have tried arithmetic vs geometric formulas and it doesn’t help. The differences you note in the investment paths are so tiny (3rd decimal place) that I presume they’re just approximation errors.
I only did the path calculations both ways (growth rate and level irfs) as a sort of sanity check. So my followup question would be: Is it safe to assume that the paths based on the growth rate irfs (where, for example, if \{g_t\} are the irfs for the growth rate of c, I generate a path for c_t starting from c_0, c_{t+1}=c_t(1+g_{t+1})) are correct, and that if there’s a discrepancy the problem is in the path from the level irfs (more complicated because of having to factor in the trend)?
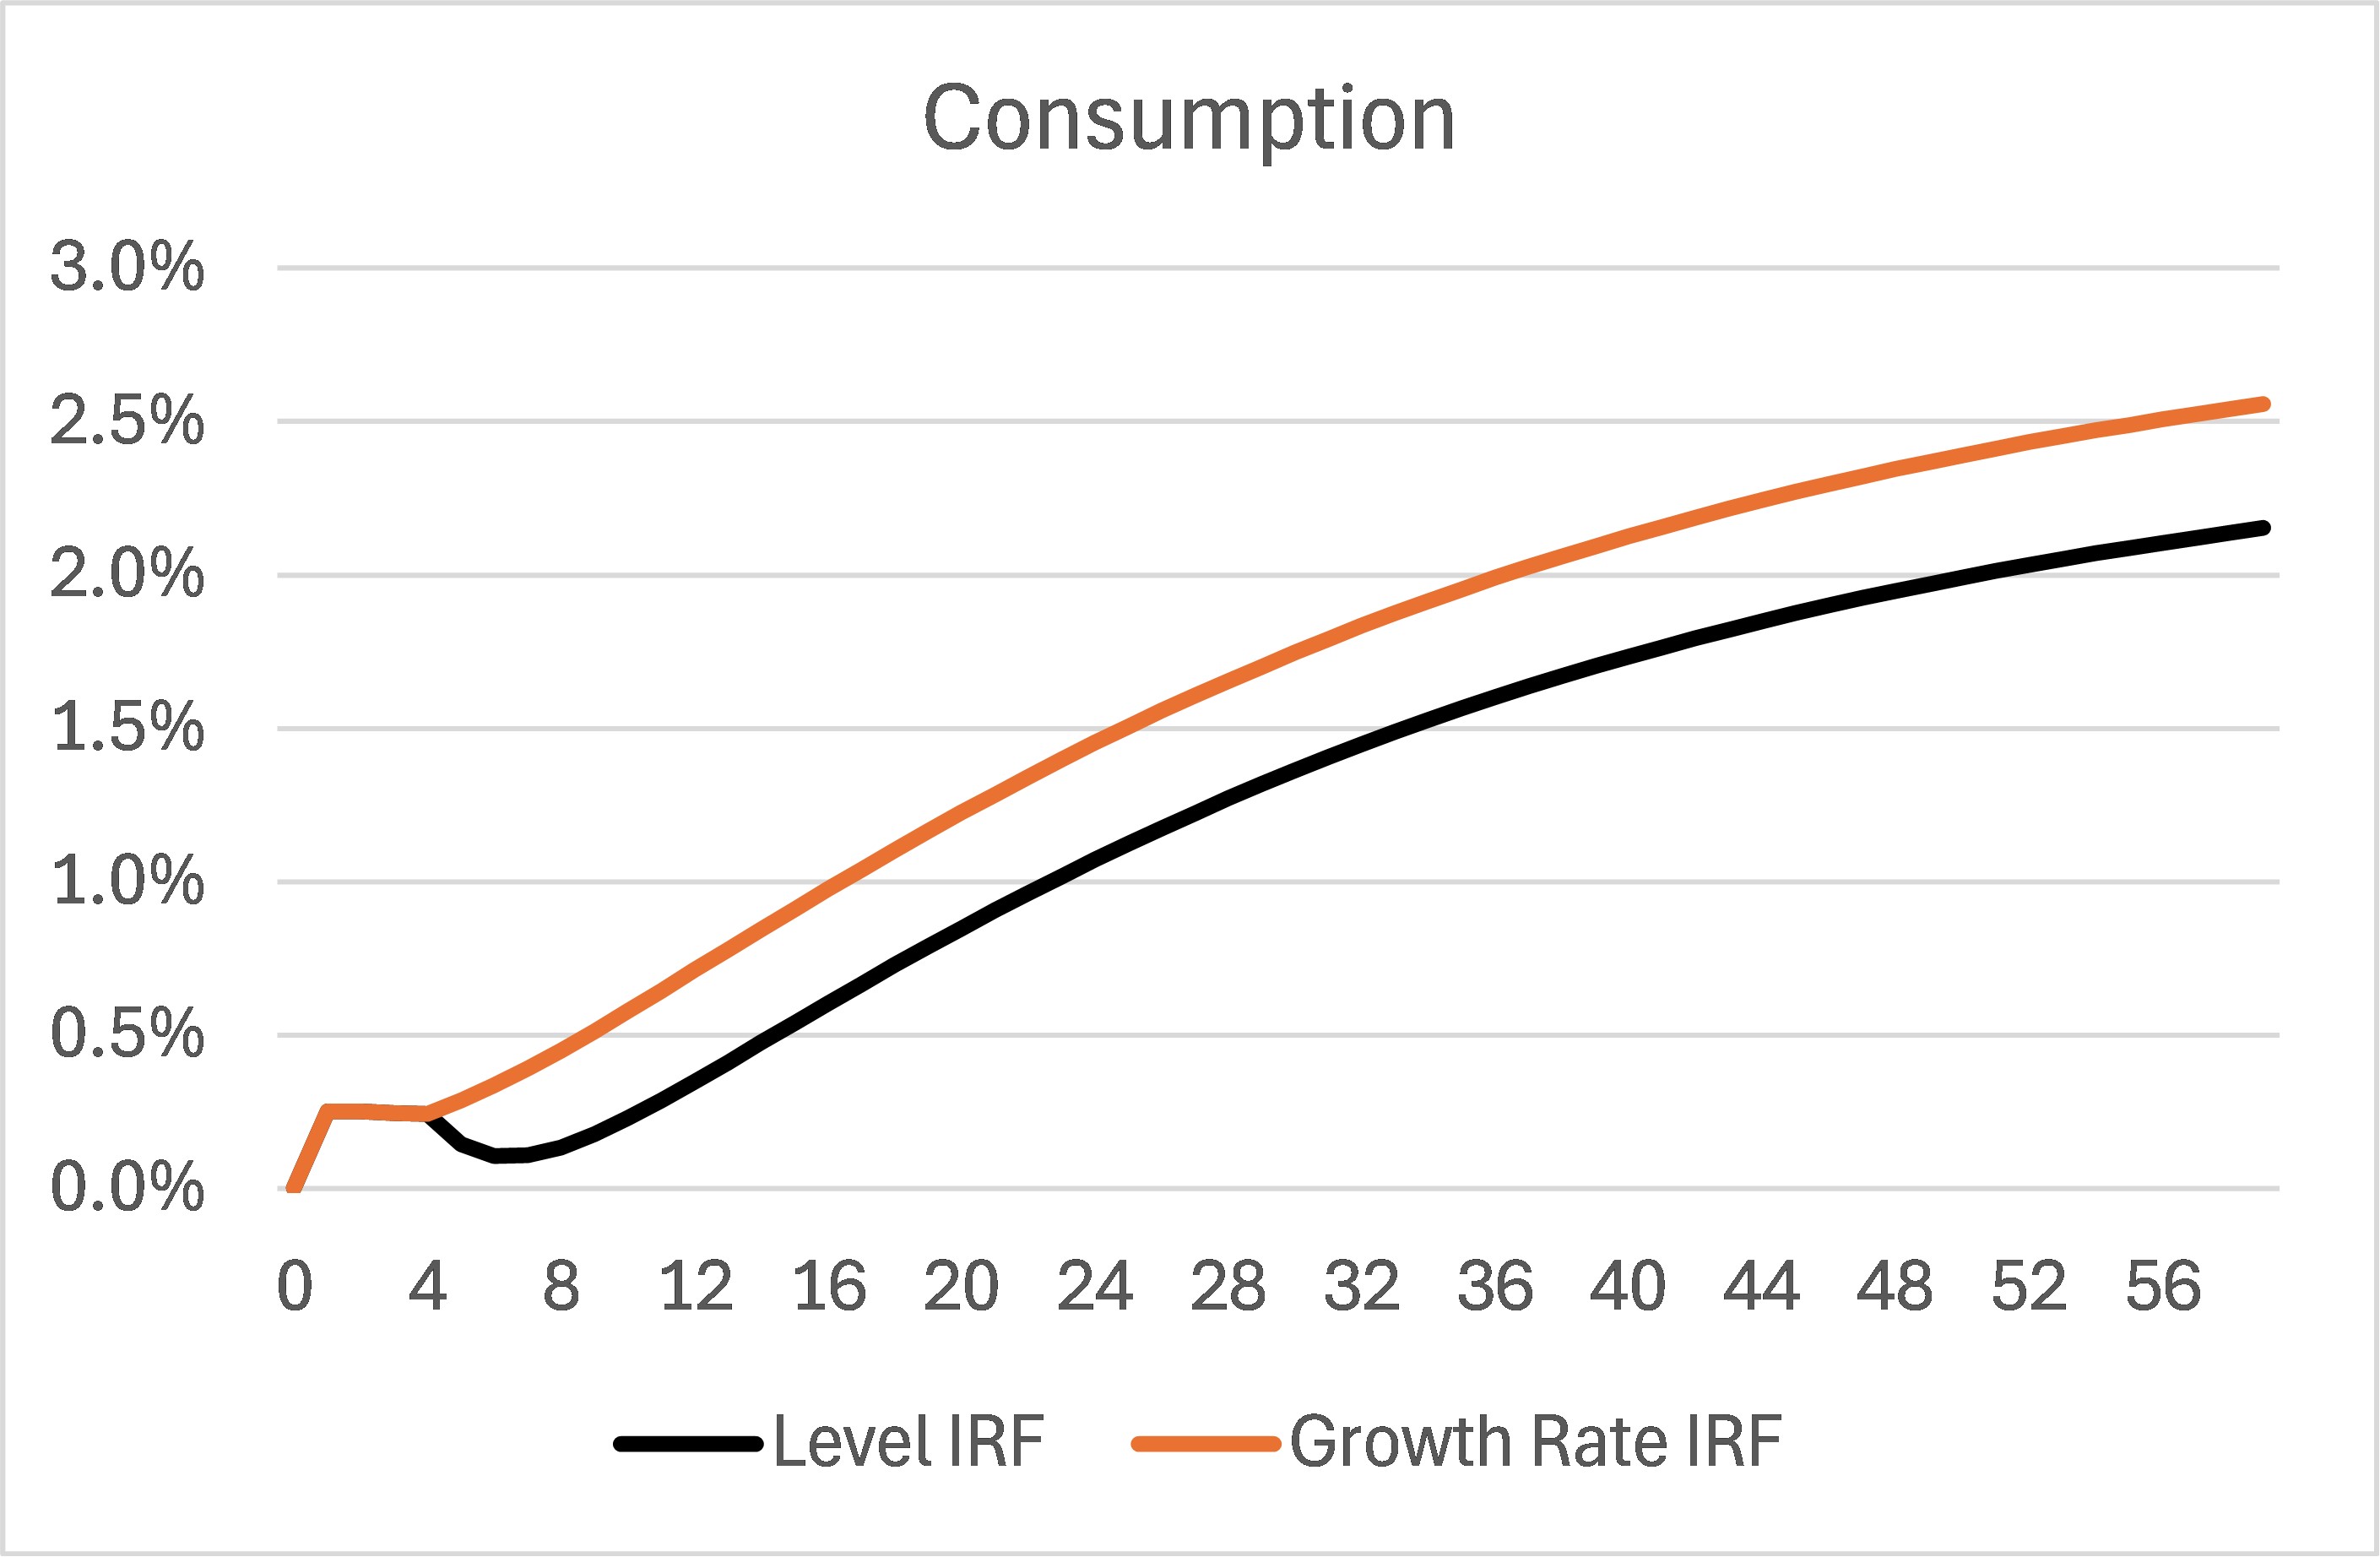
At this stage, it is hard to tell. Ideally, there should be no discrepancy and both yield the same result. I have no idea which IRF is the correct one. But you may have an idea. The IRFs for consumption are quite different. In one case, consumption falls significantly, while it continues to grow in the other. What does economic theory tell you?
That’s a good question, but not so easy. The literature (Jaimovich-Rebelo, Schmitt-Grohe-Uribe, et al) seems to rely on simulation results. J-R get monotonic responses to news shocks, but the models I’m simulating are different. I could try to replicate others. It also occurred to me that I can look at the responses of capital and labor for the consumption-producing sector to see what they imply for the consumption response.