Okay I see. After doing some changes it works, now I included a consumption tax rate \tau^C_t, and after doing the math I was estimating the model as before, now including that tax rate as an observed variable, so I have two questions:
-
Which value should I use for the consumption tax shock variance (\varepsilon_{\tau_c}) in the
shocksblock (I’m still doing it for US data). I tried a value of \varepsilon_{\tau_c} = 0.0010^2 but it displayed an error and then tried with 0.0020^2, but the mode check plot for its standard error looked strange (figure 1). -
Is there any way to plot the autocorrelation histogram plot with the trace plot as the example in figure 2.
Thanks again.
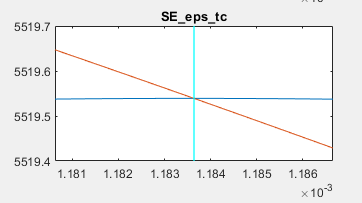
Figure 1. Mode check plot for the standard error of \varepsilon_{\tau_c}
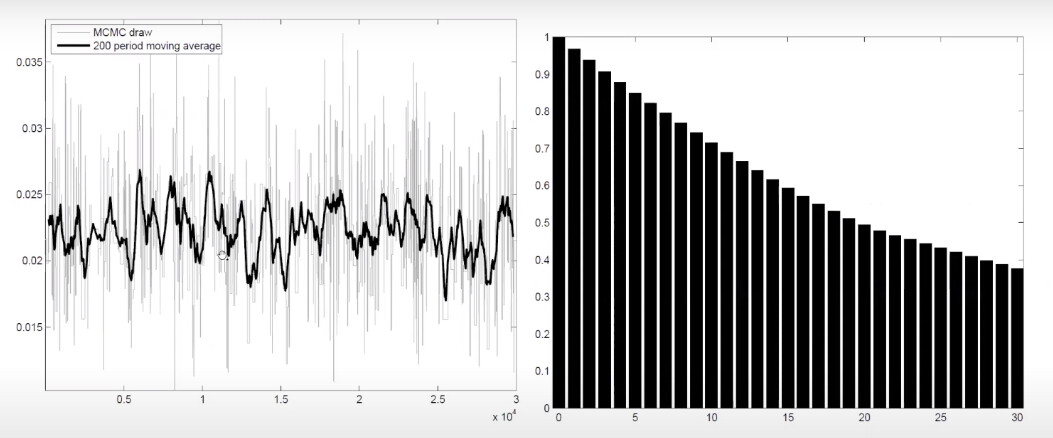
Figure 2. Trace and autocorrelation histogram plot.